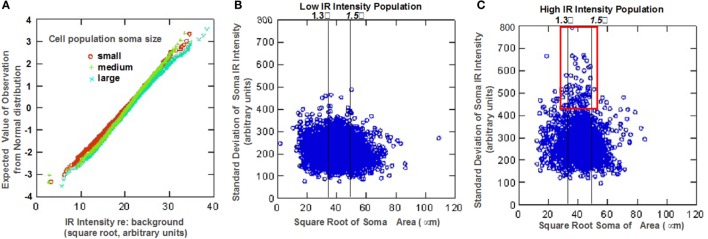
Figure 3.
Statistical analysis of neuronal 5-HT1F receptor immunohistochemistry in vestibular ganglion cells from monkey temporal bones. (A) Normal probability plots show ganglion cells with higher immunoreactive intensity tend to be larger than lower staining intensity cells. Scatter plots show (B) low and (C) high intensity staining subpopulations of the distinct neuronal staining patterns identified in Figure 2; the red square shows a subpopulation of mainly medium size cells depicted in Figure 2F.

