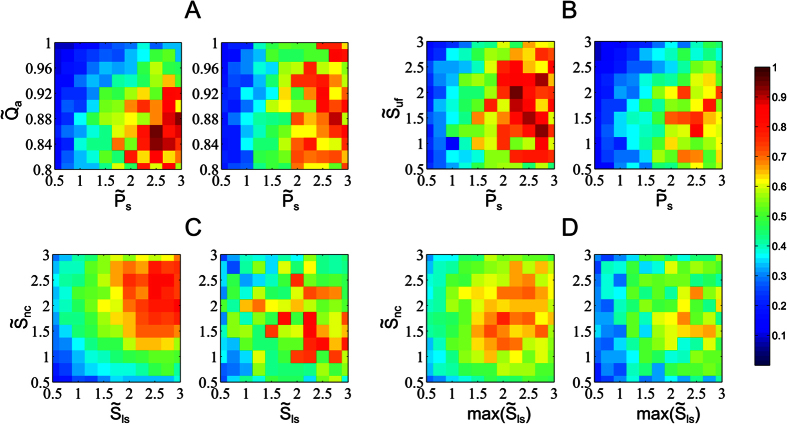
Figure 1.
Distributions of nonlinear measures ϕfj and ϕch, respectively on the left and on the right, in four different two-parameter bifurcation diagrams: left-right U-fold asymmetry  /lung pressure
  (diagram A), U-fold sizing
  /lung pressure
  (diagram B), size of the nasal cavities
  /size of the laryngeal sac
  (diagrams C,D). The
  represents parameter values normalized by their nominal values from Table 3. The simulated vocalizations of diagram C have been obtained with an upward fundamental frequency modulation, and those of diagram D have been obtained with a laryngeal sac extension.

