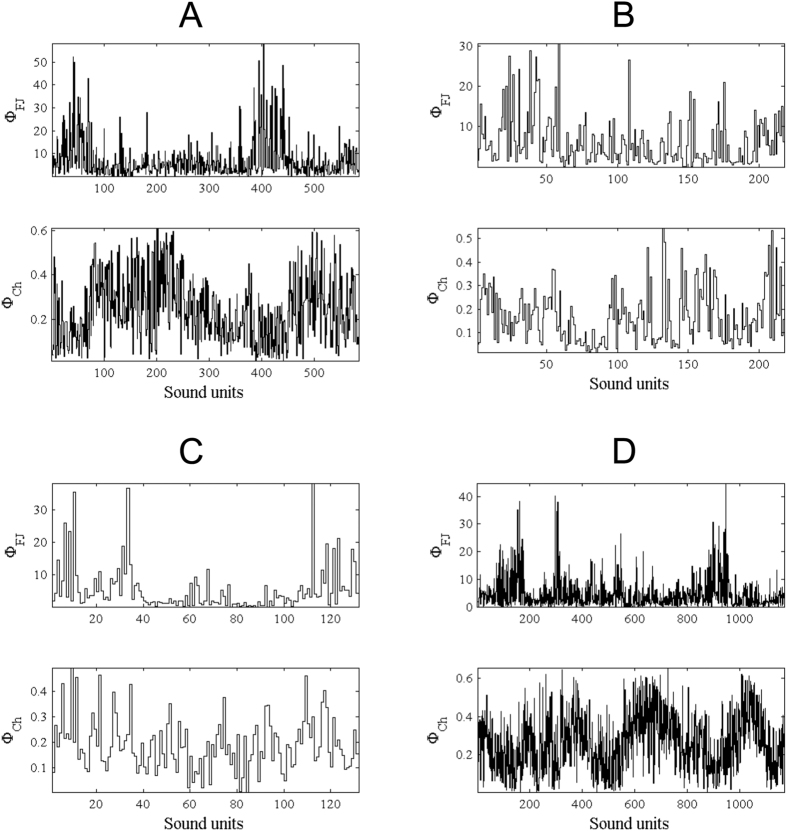
Figure 4.
Temporal evolution of the descriptors ϕfj and ϕch over four different songs (A–D) (see Table 2 for details). The difference in linewidths between the graphs is explained by their different number of sound units, from 1223 (in song A) to 116 (in song B).

