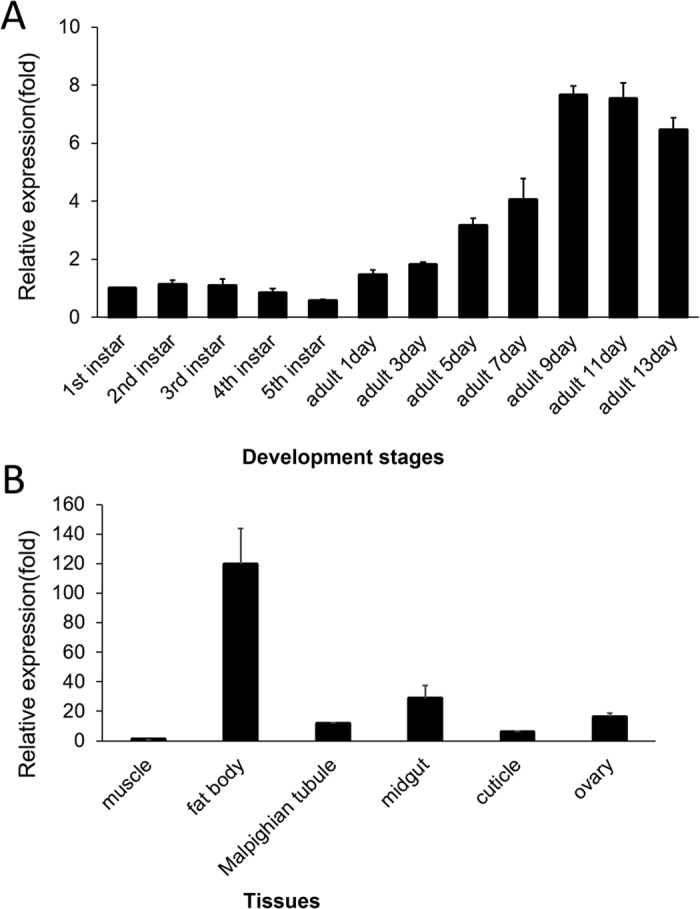
Figure 2. Developmental expression and tissue distribution of CYP6ER1.

(A) Developmental expression of CYP6ER1 mRNA by qRT-PCR.Nymphs1–5: the 1st instar nymphs to the 5th instar nymphs; Adults odd day of 1–13 days: female adults from the odd day of 1 to 13 days. The mRNA levels of CYP6ER1 were relative to the β-actin mRNA level and the mRNA expression level in 1st instar are designated as one. The data represent the mean + SEM (n = 30). (B) Tissue distribution of CYP6ER1. Fat body, Ovary, Midgut, Cuticle, Malpighian tubule and muscle. The mRNA levels of CYP6ER1 were relative to the β-actin mRNA level and the mRNA expression level in muscle is designated as one. The data represent the mean + SEM (n = 3).
