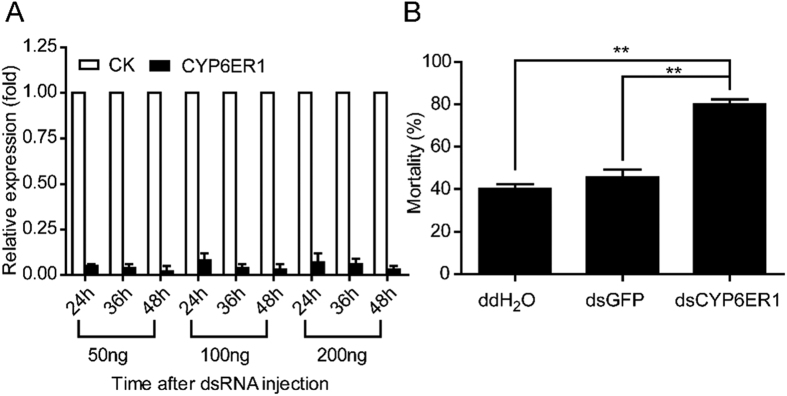
Figure 3. Detection of the mRNA level and mortality after RNA interference (RNAi).
(A) The CYP6ER1 mRNA expression level after injecting three doses (50 ng, 100 ng and 200 ng) of dsCYP6ER1 at three time points. The mRNA expression level of CYP6ER1 in dsGFP ground and dsCYP6ER1 group were relative to β-actin mRNA level and the mRNA expression level of CYP6ER1 in dsGFP group was designated as one. (B) Effects on the mortality rate after injection of water or dsGFP or dsCYP6ER1 and followed by application of imidacloprid (50 ng/ml). Double asterisks indicate significant differences in the mRNA relative expression level between the treatment and control groups (P < 0.01, t-test). The data represent the mean + SEM (n = 3), **P < 0.01 level (t-test).

