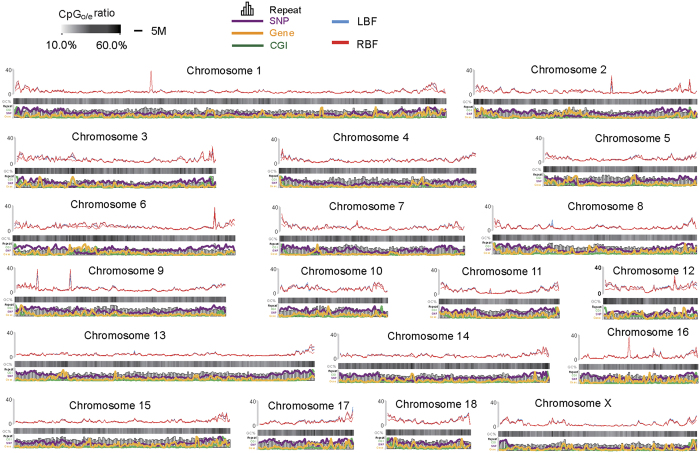
Figure 2. Chromosomal profiles of LBF and RBF methylomes.
The distribution of DNA methylation levels throughout the pig genome was analyzed. To compare DNA methylation ra stes among samples, read depth was normalized to the overall average amount of reads in each group, and then a 1 Mb sliding window was used to smooth the distribution. CpGo/e ratio, SNP density, gene, repeat and CGI were all calculated based on this 1 Mb sliding window.

