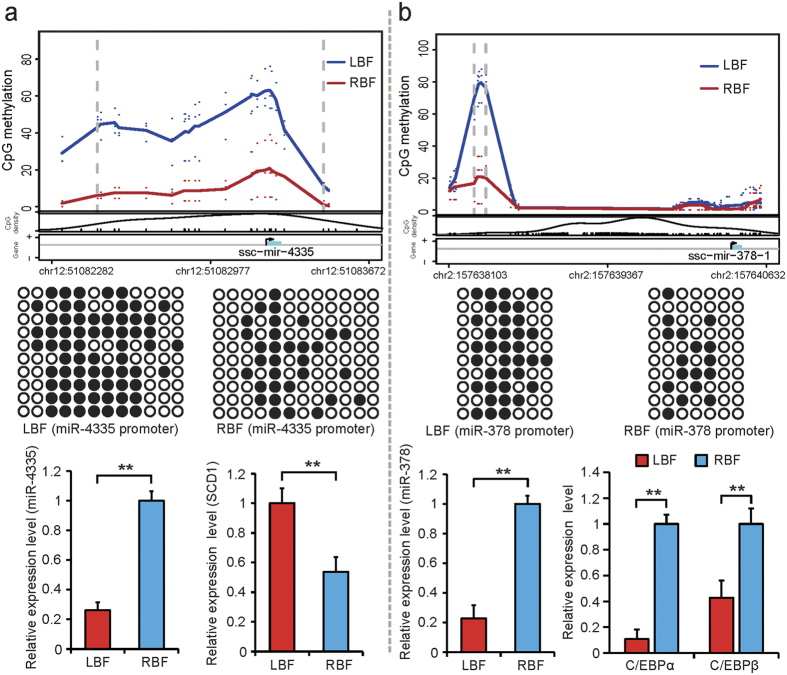
Figure 6. Differentially methylated promoters of miRNA involved in fatty acid metabolism.
(a) DMR in miR-4335 promoter. (b) DMR in miR-378 promoter. For upper panels, each point represents the methylation level (MeDIP-seq read depth) of a sample at CpG site. The curves depict average percentages of all samples. The two vertical dashed lines mark the boundaries of the identified DMR. Middle panels show the validation of CpG methylation by BSP. Ten subclones were selected for the BSP analysis. Solid circles represent methylated CpG sites, and open circles represent unmethylated CpG sites. Lower panels display relative expression levels of genes in LBF and RBF. Gene expression levels were detected by Q-PCR and normalized to the expression levels in high one. Student’s paired t-test (n = 3). **P < 0.01.

