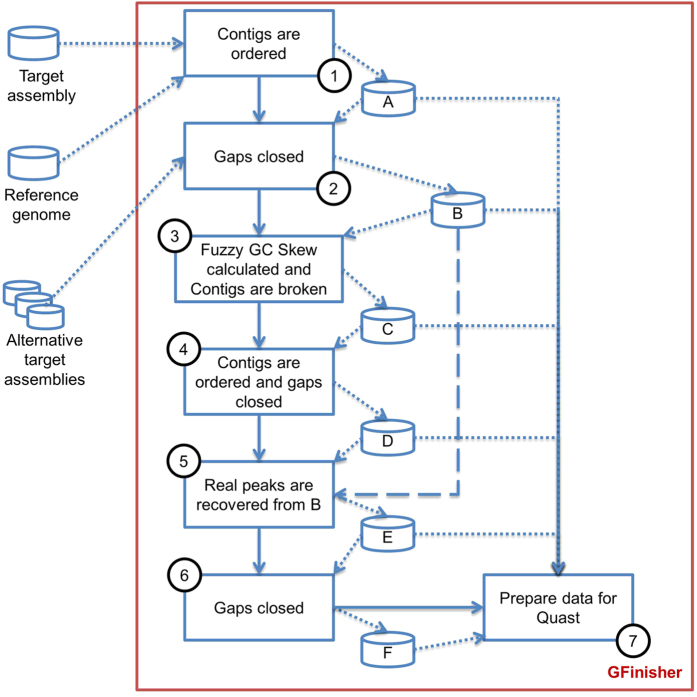
Figure 1. GFinisher workflows.
A target assembly, some alternative assemblies and a reference genome sequence are inputs for the program. Numbered boxes represent the seven main steps in the analysis. A–F represents intermediate assemblies generated during the analysis. Solid lines show the process flows and dotted lines show the assembly flow. In step 5, intermediate assemblies B and D are compared to recover the true critical points (dashed line).

