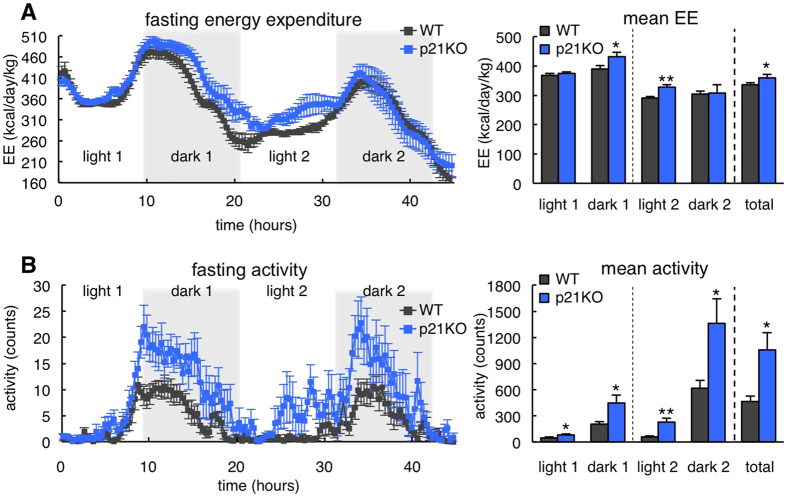
Figure 3. Increased energy expenditure and activity in p21Cip1-deficient mice during fasting.
(A) Left, energy expenditure (EE) of WT and p21KO mice during 48 h of fasting. Right, mean EE of WT and p21KO mice at the indicated periods (n = 8 male mice, 12 weeks old). (B) Left, activity of WT and p21KO mice during 48 hours of fasting. Right, mean activity of WT and p21KO at the indicated periods under fasting conditions (same mice as in panel A). Values correspond to average ± s.e.m. Statistical significance was determined by the two-tailed Student’s t test: *p < 0.05, **p < 0.01. See also Figure S2.

