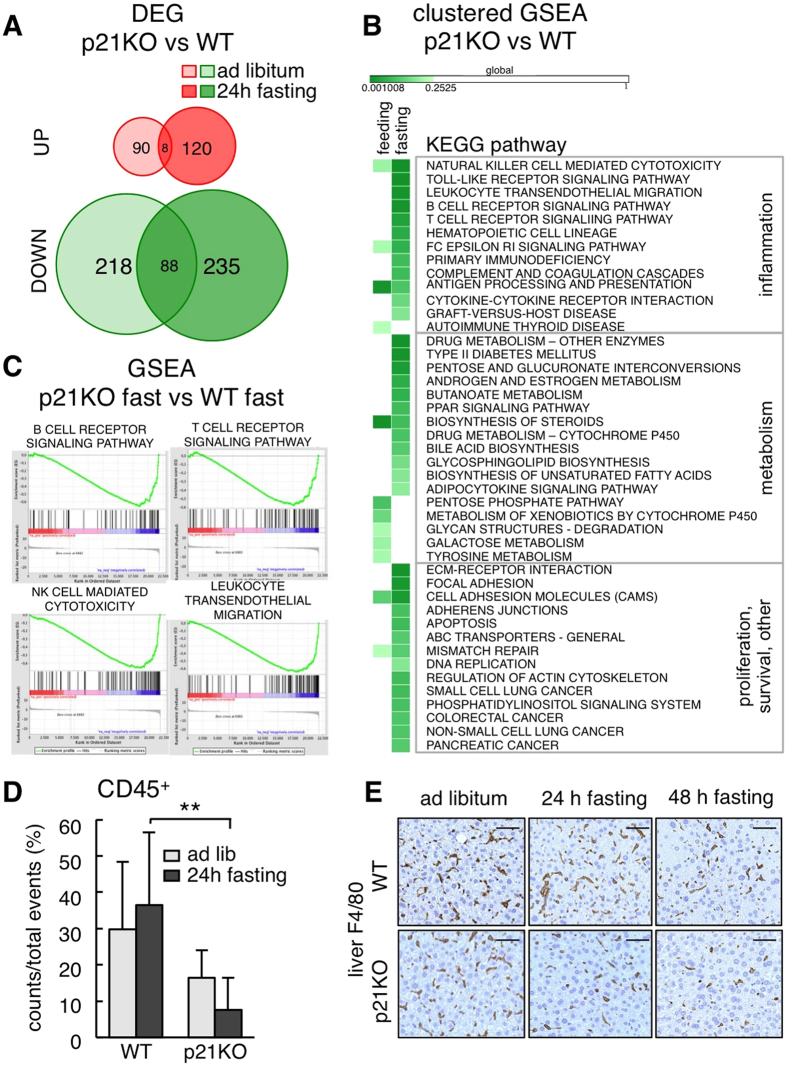
Figure 4. Global transcription changes in p21Cip1-deficient mice.
(A) Differentially expressed genes (DEG) in the liver of p21KO compared to WT mice under ad libitum feeding conditions and upon 24 h fasting. Data were obtained from RNA-Seq analysis of 2–3 male mice per group. Red circles correspond to upregulated and green circles to downregulated genes. Values were considered significant when FDR value was q < 0.05. (B) Heat map of significantly altered pathways in the liver in the same samples as in panel A. Results were obtained from GSEA and considered significant when FDR < 0.25. (C) Representative GSEA plots of immune-related pathways downregulated in fasted p21KO mice compared to fasted controls. FDR < 0.25. (D) Relative amount of CD45+ immune cells in the liver of ad libitum fed and 24 h fasted WT and p21KO mice. Values correspond to average ± s.d. (n = 6 males, 12–16 weeks old). (E) Representative pictures of F4/80 stained liver sections of WT and p21KO mice under feeding conditions, 24 h and 48 h fasting. Bars correspond to 50 μm. Statistical significance was determined by two-way ANOVA and Bonferroni post-hoc test: **p < 0.01. See also Figure S3.

