
Figure 7. A heat map of the Spearman rank correlation betweenEq. 8 and the number of individuals infected with EVD within a time Δt, as a function of the bandwidth h and the time window width, Δt in Eq. 8.
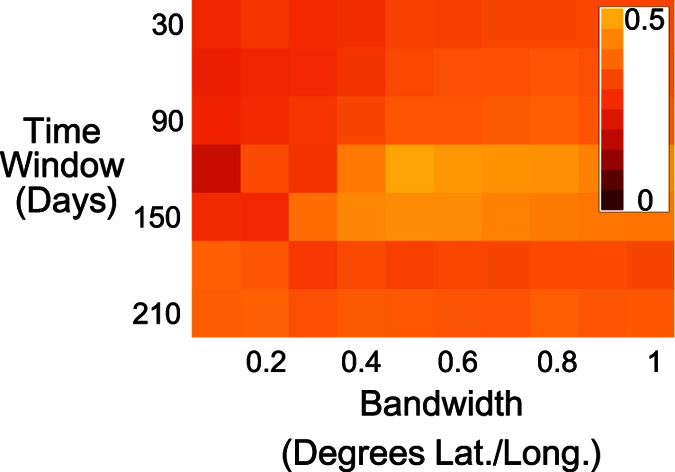
The correlation between the model and data is highest (Spearman ρ = 0.50, p < 0.01, n = 68) when the bandwidth is 0.5 degrees and the time window width is 120 days.