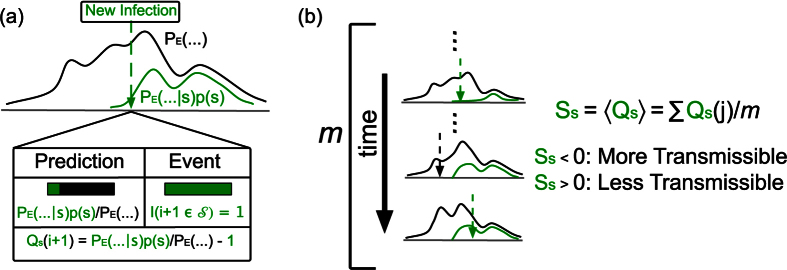
Figure 8. A schematic for our success metric.
(a) When a new infection appears, the probability the infection would be a strain s is  . We define Qs to be the difference between the prediction and actual event. (b) Ss, the expectation value of Qs, should be 0 if s is no more transmissible than the disease as a whole. If Ss < 0, then we would say that s is more transmissible than the typical strain, while the opposite is true if Ss > 0.

