
Figure 1. IGF-I improved glucose tolerance, visceral fat area, hepatocyte injury, and fibrosis in NASH model mice.
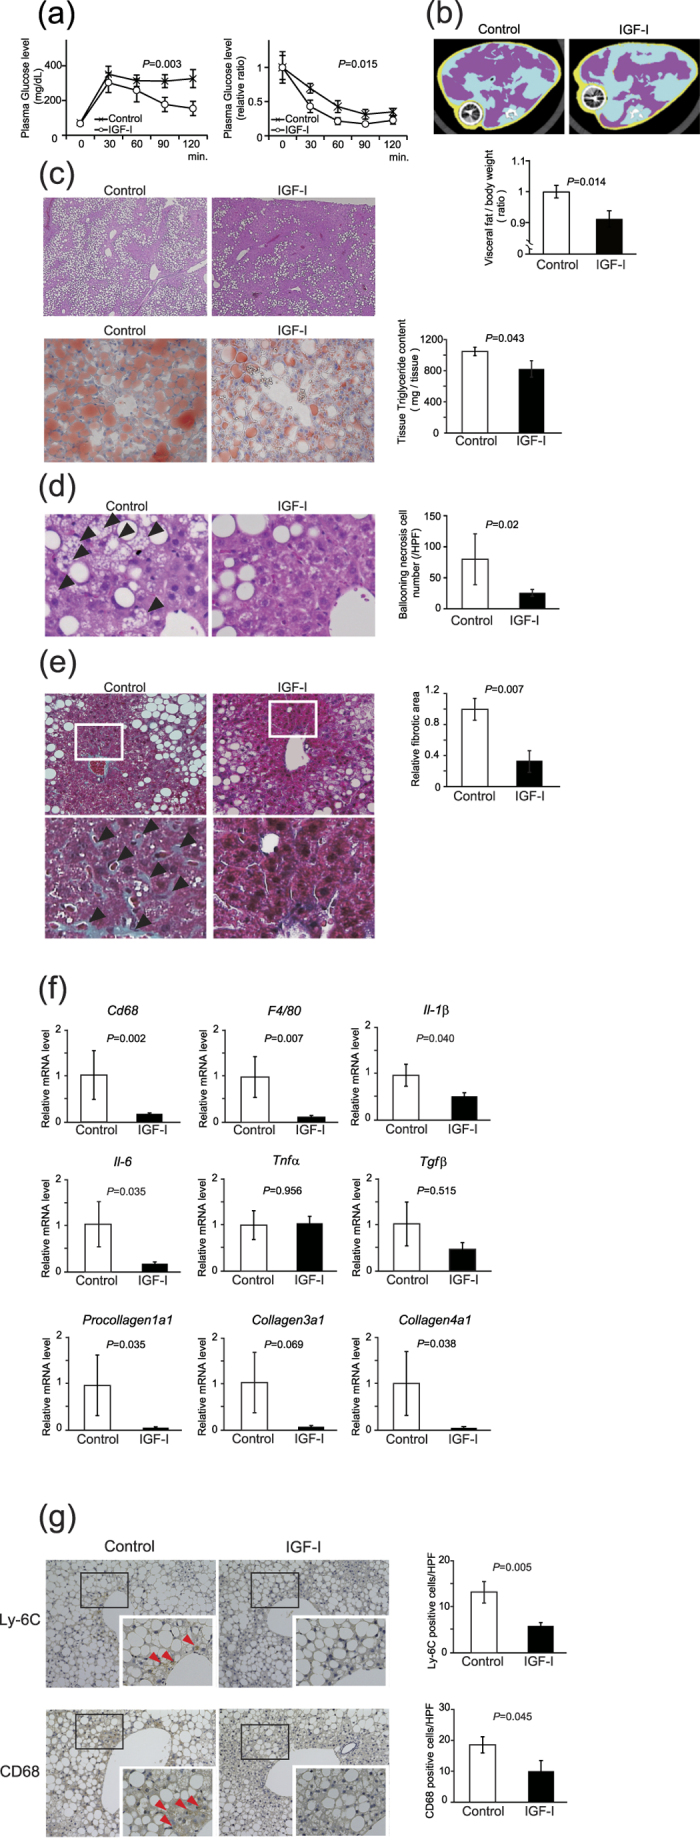
MCD-db/db mice were treated with vehicle or IGF-I for 4 weeks using osmotic pump (n = 5 for each group). (a) Intraperitoneal glucose tolerance test and intraperitoneal insulin tolerance test. Data were compared by MANOVA test. (b) Visceral fat area visualized by computed tomography. Red areas show intraperitoneal fat. The osmotic infusion pump revealed a round-shaped and darkened figure. Quantitative analysis shows decreased visceral fat area in the IGF-I treatment group. (c) Histological analysis of the liver (hematoxylin-eosin staining, 100×) and Oil red-O staining (200×) and Triglyceride content in the liver. (d) Histological analysis of the liver (hematoxylin-eosin staining, 600×). The arrow heads denote ballooning necrosis of hepatocytes. Quantitative analysis of the number of hepatocytes showing ballooning necrosis. (e) The analysis of fibrosis by masson’s trichrome staining (400×). The arrow heads denote blue-colored pericellular fibrosis in the liver (upper panel 10×, lower panel 600×). Quantitative analysis of fibrotic area. Values are mean ± SEM. (f) Quantitative realtime PCR analysis of macrophage (Cd68 and F4/80), inflammatory (Tnfα), pro-inflammatory cytokines (Il-1β and Il-6), and fibrotic markers (Tgfβ, Procollagen 1a1, Collagen 3a1, and Collagen 4a1). Data were compared by Student’s t test. (g) Immunohistochemical analysis using Ly-6C (a marker for neutrophils) and CD68 antibodies (n = 5 for each groups). The arrow heads denote Ly-6C- and CD68-potitive (a marker for macrophages or Kupffer cells) cells. (f) Quantitative analysis of the number of Ly-6C and CD68-positive cells in the liver. Data were compared by Student’s t test.