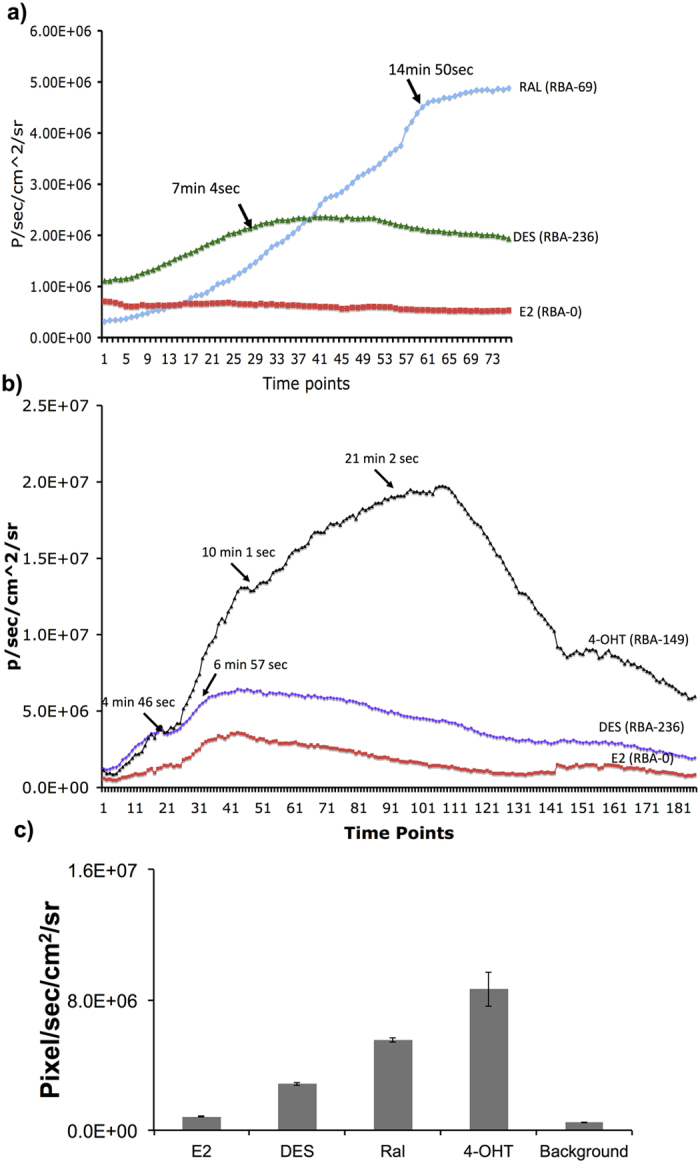
Figure 4. Dynamic imaging of NFLuc-ERα-LBD (G521T)-CFLuc transgenic mice in response to ER-ligands of different binding affinities.

(a) Graph showing the FLuc signals measured dynamically at different time points after injection with 1 μg of Raloxifene, E2, and DES. (b) Graph showing the FLuc signals measured at different time points after injection with 1 μg of E2, DES, and 4-OHT. (c) Graph showing maximum FLuc signals measured in transgenic mice injected with ligands E2, Ral, DES and 4-OHT. Error bars, mean ± s.e.m.
