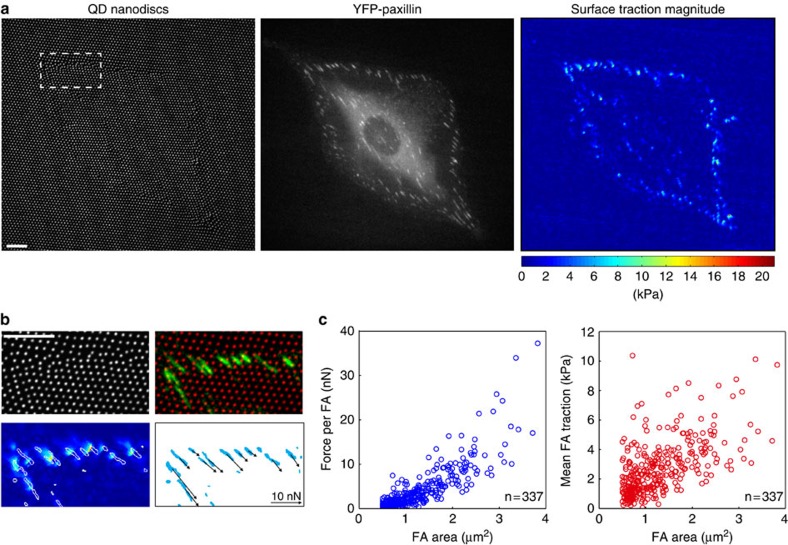
Figure 2. High-resolution detection of forces exerted at focal adhesions.
(a) REF-Pax cell on cTFM substrate with red QD nanodiscs (spacing: 1.5 μm). Scale bar, 10 μm. Reconstructed surface tractions peaks are located at the cell circumference. (b) Surface traction peaks and focal adhesions colocalize. Scale bar, 10 μm. The lower right panel depicts the magnitude and direction of forces exerted by individual focal adhesions. (c) Force and traction exerted by individual focal adhesions (only focal adhesions with an area >0.5 μm2 were analysed). Data from n=337 focal adhesions detected in four cells from independent experiments via integration of traction stress over focal adhesion area.

