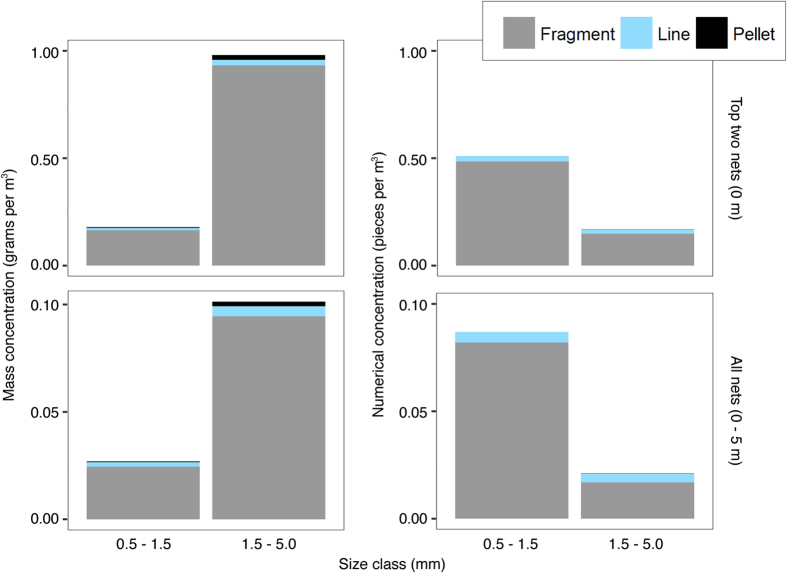
Figure 3. Mass and numerical concentrations of microplastics at 0 m and 0–5 m depth.
Average microplastic mass concentrations (left) and numerical concentrations (right), for the ocean surface (top) and 0–5 m depth (bottom). Note the different y-scales for the different graphs. Foam concentrations cannot be visualised due to insufficient quantities.

