
Figure 4. Microplastic terminal rise velocities.
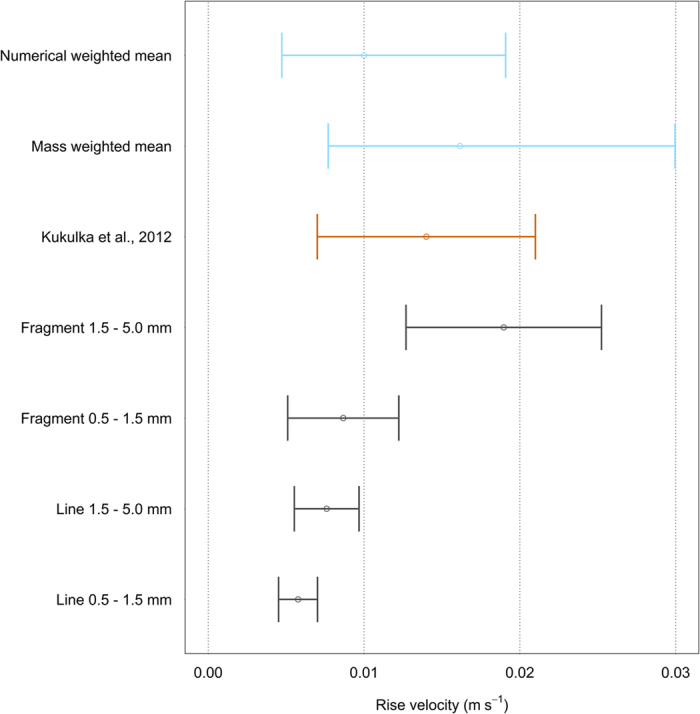
Numerical and mass weighted mean terminal rise velocities with weighted minimum and maximum values (blue), the average buoyant terminal rise velocity ± standard deviation reported by Kukulka et al.11 (orange) and the terminal rise velocities ± standard deviations for different plastic categories (grey).