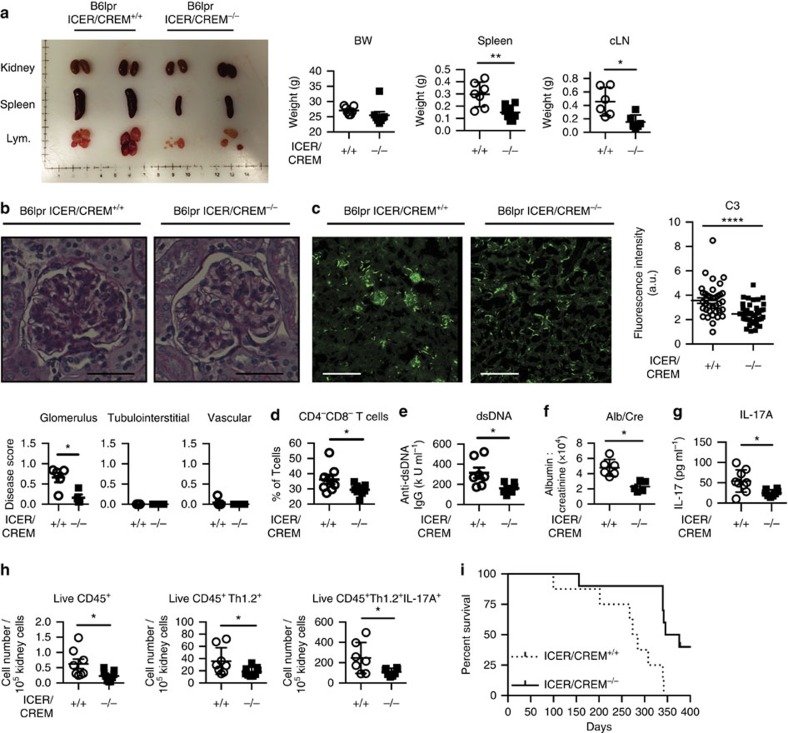
Figure 6. B6.lpr.ICER/CREM−/− mice display less autoimmunity.
(a) B6.lpr.ICER/CREM+/+ (n=7) and B6.lpr.ICER/CREM−/− (n=8) mice were killed at 28 weeks of age. Kidney, spleen (n=7 and 8 mice, respectively) and cervical lymph nodes (n=6 per group) were dissected and weighted (*P<0.05, **P<0.01; mean±s.e.m.). (b) Periodic acid–Schiff (PAS)-stained kidney section and disease scores were shown (*P<0.05; mean±s.e.m.; n=5 per group). Scale bar, 50 μm. (c) C3 deposition in the kidney sections was assessed by direct immunofluorescence. Scale bar, 300 μm. Cumulative data are shown on the right (****P<0.0001; mean±s.e.m.; cumulative results of total 36 glomerulus from 5 B6.lpr.ICER/CREM+/+ and total 40 glomerulus from 5 B6.lpr.ICER/CREM−/− mice were assessed). (d) Percentage of double-negative T cells was evaluated by flow cytometry (8 B6.lpr.ICER/CREM+/+ and 9 B6.lpr.ICER/CREM−/−). Serum anti-dsDNA IgG (7 B6.lpr.ICER/CREM+/+ and 6 B6.lpr.ICER/CREM−/−) (e), urinary albumin to creatinine ratio (n=6 per group) (f) and serum IL-17A (7 B6.lpr.ICER/CREM+/+ and 8 B6.lpr.ICER/CREM−/−) (g) were quantified by ELISA (*P<0.05; mean±s.e.m.). (h) Kidney-infiltrated CD45+ cells, T cells and IL-17A-producing T cells were evaluated by flow cytometry (*P<0.05; mean±s.e.m.; 8 B6.lpr.ICER/CREM+/+ and 9 B6.lpr.ICER/CREM−/−). (i) Survival of indicated mice was monitored (8 B6.lpr.ICER/CREM+/+ and 10 B6.lpr.ICER/CREM−/−).

