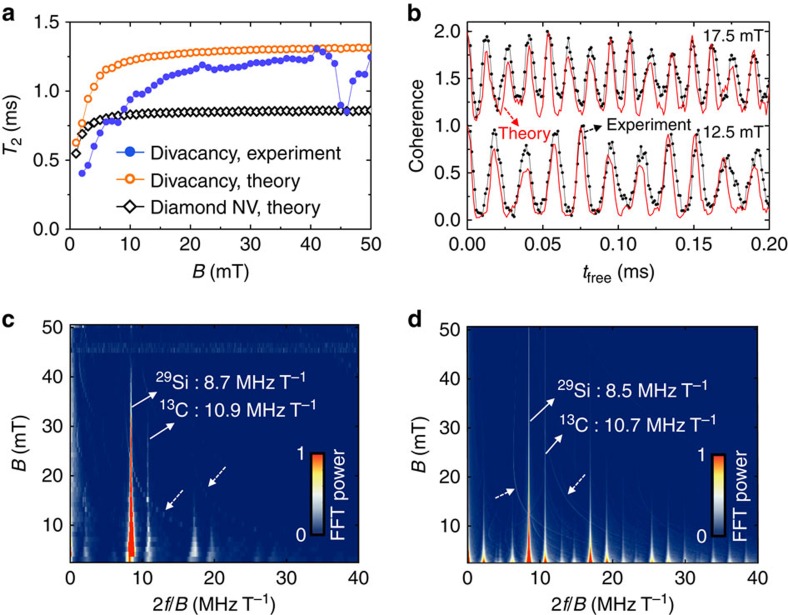
Figure 3. Analysis of the divacancy coherence.
(a) Experimental Hahn-echo coherence time (T2) of the divacancy spin ensemble as a function of magnetic field (B) (filled circles) compared with theoretical T2 of the divacancy (empty circles) and theoretical T2 of the NV centre in diamond (empty diamonds). The divacancy T2 rises significantly, up to ∼20 mT, and is then roughly constant, except for a dip at 47 mT, corresponding to the ground-state level anti-crossing (GSLAC). (b) A direct comparison between the theoretical (red curve) and experimental (black curve) Hahn-echo coherence of the divacancy spin ensemble at two different magnetic fields of 17.5 mT (up) and 12.5 mT (down). (c,d) Experimental (c) and theoretical (d) FFT power spectrum of the ms=+1 to ms=0 ground-state spin coherence data of the divacancy from Fig. 2c,d, respectively. The frequency axis (x axis) is normalized to B, so that the nuclear precession frequencies appear as vertical lines. Harmonics of these frequencies can also be seen both in theory and experiment. After 7 mT, the FFT intensities diminish as B is increased. The hyperbolic features denoted by dotted arrows correspond to weak hyperfine interactions.

