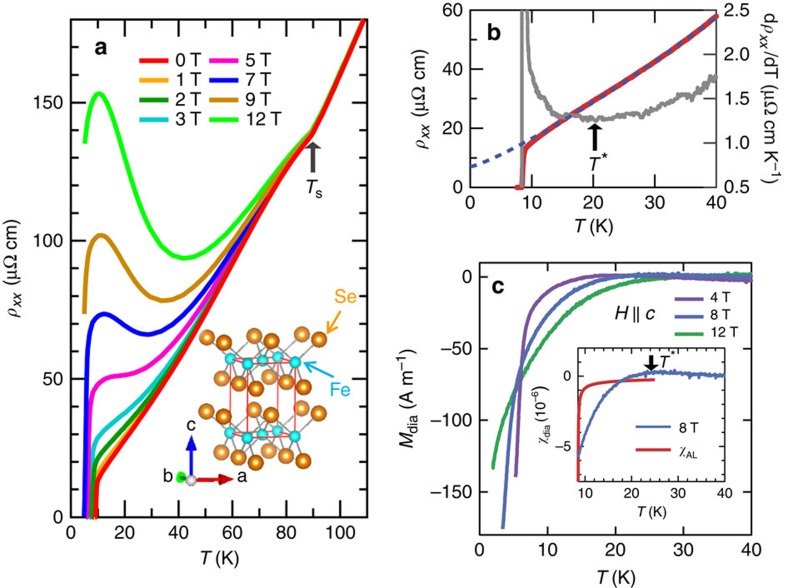
Figure 1. Excess conductivity and diamagnetic response of a high-quality single crystal of FeSe.
(a) T dependence of ρxx in magnetic fields (H||c). The structural transition occurs at Ts=90 K, which is accompanied by a kink in ρxx(T). Inset shows the crystal structure of FeSe. (b) T dependence of ρxx (red) and dρxx/dT (grey). Below T* shown by arrow, ρxx shows a downward curvature. The blue dashed line represents ρxx(T)=ρ0+ATα with ρ0=7 μΩ cm A=0.6 μΩ cm K−2 and α=1.2. (c) Diamagnetic response in magnetization Mdia for H||c. The inset shows the diamagnetic susceptibility χdia at 8 T (blue) compared with the estimated χAL in the standard Gaussian fluctuations theory (red).

