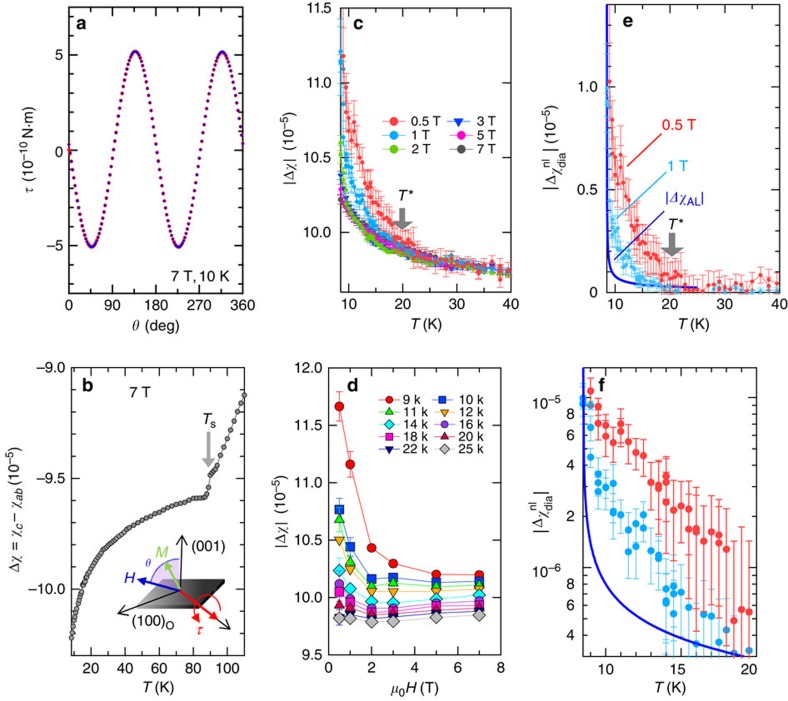
Figure 2. Diamagnetic response detected by magnetic torque measurements above Tc.
(a) The magnetic torque τ as a function of θ. Torque curves measured by rotating H in clockwise (red) and anticlockwise (blue) directions coincide (the hysteresis component is <0.01% of the total torque). (b) Anisotropy of the susceptibility between the c axis and ab plane, Δχ, at 7 T. The inset is schematics of the θ-scan measurements. (c) The T dependence of |Δχ| at various magnetic fields. (d) The H dependence of |Δχ| at fixed temperatures. (e) Temperature dependence of the non-linear diamagnetic response at μ0H=0.5 T (red) and 1 T (blue) obtained by  . Blue line represents the estimated |ΔχAL| in the standard Gaussian fluctuations theory. (f)
  plotted in a semi-log scale at low temperatures. Error bars represent s.d. of the sinusoidal fit to the τ(θ) curves.

