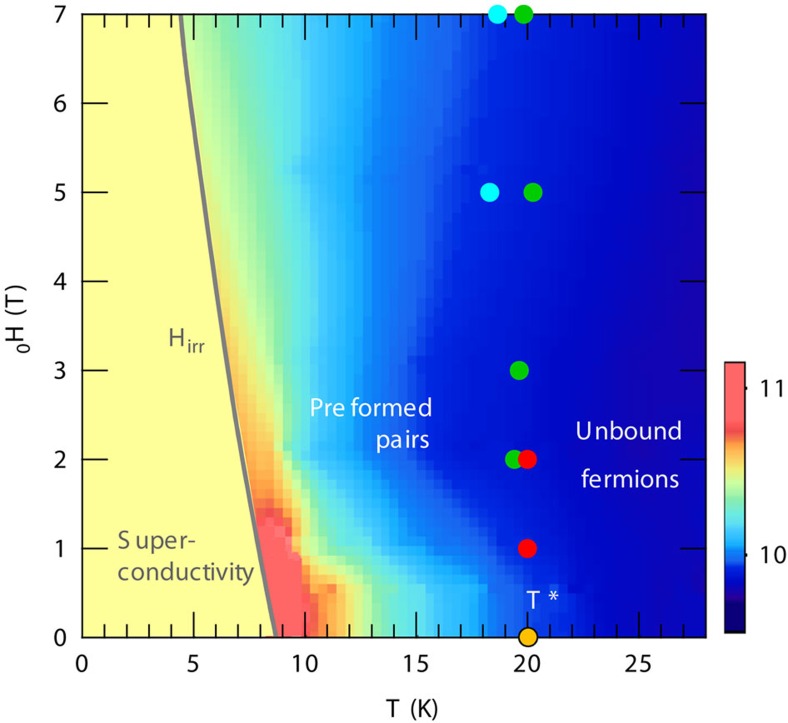
Figure 4. H–T phase diagram of FeSe for H||c.
Solid line is the irreversibility line Hirr(T) (ref. 14). The colour represents the magnitude of Δχ (in 10−5, scale shown in the colour bar) from magnetic torque measurements (Fig. 2c). Preformed pair regime is determined by the minimum of dρxx(H)/dT (blue circles), the peak of Nernst coefficient νpeak (green circles) and the onset of Δ(1/T1T) in the NMR measurements (red circles).

