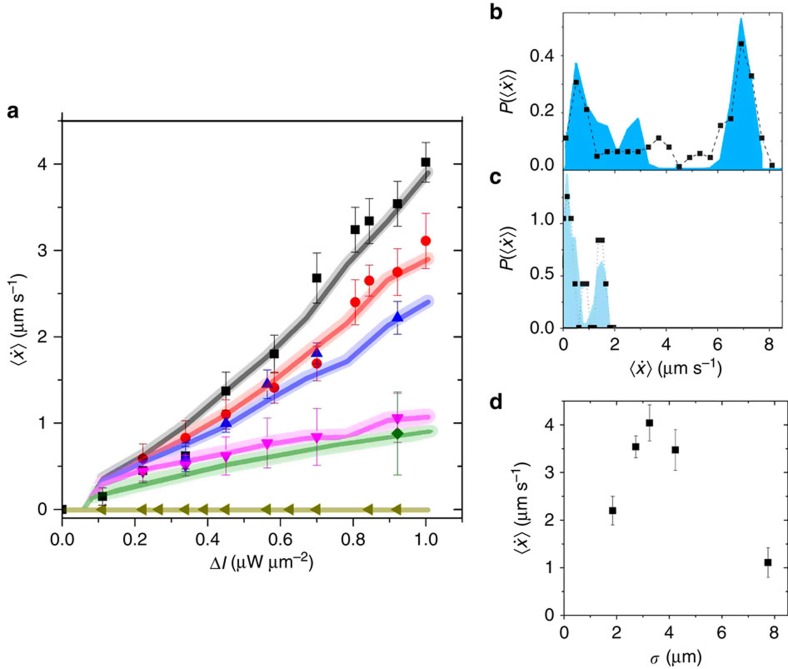
Figure 5. Particle current in periodic asymmetric light profiles.
(a) Average velocity  versus intensity amplitude ΔI obtained from experiments (symbols) and numerical simulations (solid curves), for a/b=0.22 (squares), 0.28 (circles), 0.33 (triangles), 0.55 (diamonds), 0.75 (inverted triangles) and 1.0 (pentagons). The experimental data points were obtained by averaging the velocity over ∼200 periods each. Error bars correspond to 95% of the confidence interval. (b,c) PDFs of
  for a/b=0.22 and (b) ΔI=1.0 μW μm−2 and (c) ΔI=0.22 μW μm−2, obtained from experiments (symbols) and numerical simulations (filled areas). (d) Average velocity
  for different particle diameters σ, for a/b=0.22 and ΔI=0.92 μW μm−2.

