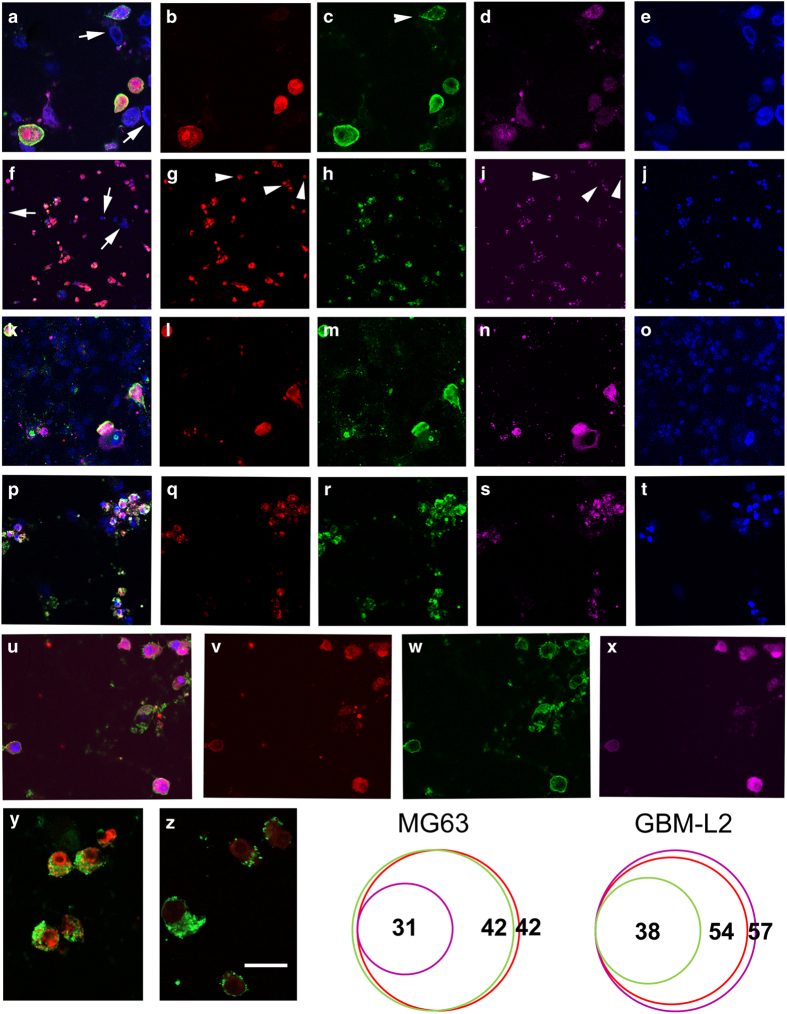
Figure 1.
Cell lines induced to undergo apoptosis with treatment of staurosporine for 19 h, representative images of >20 separate experiments. Treated cell cultures were live stained with mAb2C4:AF568 and annexin V:AF488 prior to fixation and staining with anti-cleaved caspase 3 antibody. (a–e) A172 cells treated with 1 μM staurosporine: (a) merged image, arrows indicate examples of nuclei from unaffected cells; (b) mAb2C4:AF568; (c) annexin V:AF488, the arrowhead indicates an example with no uptake of mAb2C4:AF568; (d) caspase 3; and (e) DAPI (4,6-diamidino-2-phenylindole). (f–j) GBM-L2 cells treated with 1 μM staurosporine: (f) merged image, arrows indicate examples of nuclei from unaffected cells; (g) mAb2C4:AF568; (h) annexin V:AF488; (i) caspase 3; and (j) DAPI. The arrowheads in panels (g and i) indicate apoptotic cells for which there is little or no annexin V:AF488 signal. (k–o) COS-7 cells treated with 1 μM staurosporine: (k) merged image; (l) mAb2C4:AF568; (m) annexin V:AF488; (n) caspase 3; and (o) DAPI. (p–t) Primary mouse neural precursor cells treated with 0.1 μM staurosporine: (p) merged image; (q) mAb2C4:AF568; (r) annexin V:AF488; (s) caspase 3; and (t) DAPI. (u–x) MG63 cells were treated with 1 μM staurosporine: (u), a merged image; (v) mAb2C4:AF568; (w) annexin V:AF488; and (x) cleaved caspase 3. MG63 cells were treated with 1 μM staurosporine showing merged images with annexin V:AF488 plus ((y), HFEs) and minus ((z), autofluorescence) mAb2C4:AF568. Venn diagrams of relative cell counts for the cell line MG63 and GBM-L2, and overlap for annexin V, mAb2C4:AF568 and caspase 3. The calibration bar shown in panel (z) represents (a–e) 25 μm; (f–j) 80 μm; (k–o) 25 μm; (p–t) 60 μm; (u–x) 25 μm; (y and z) 20 μm.

