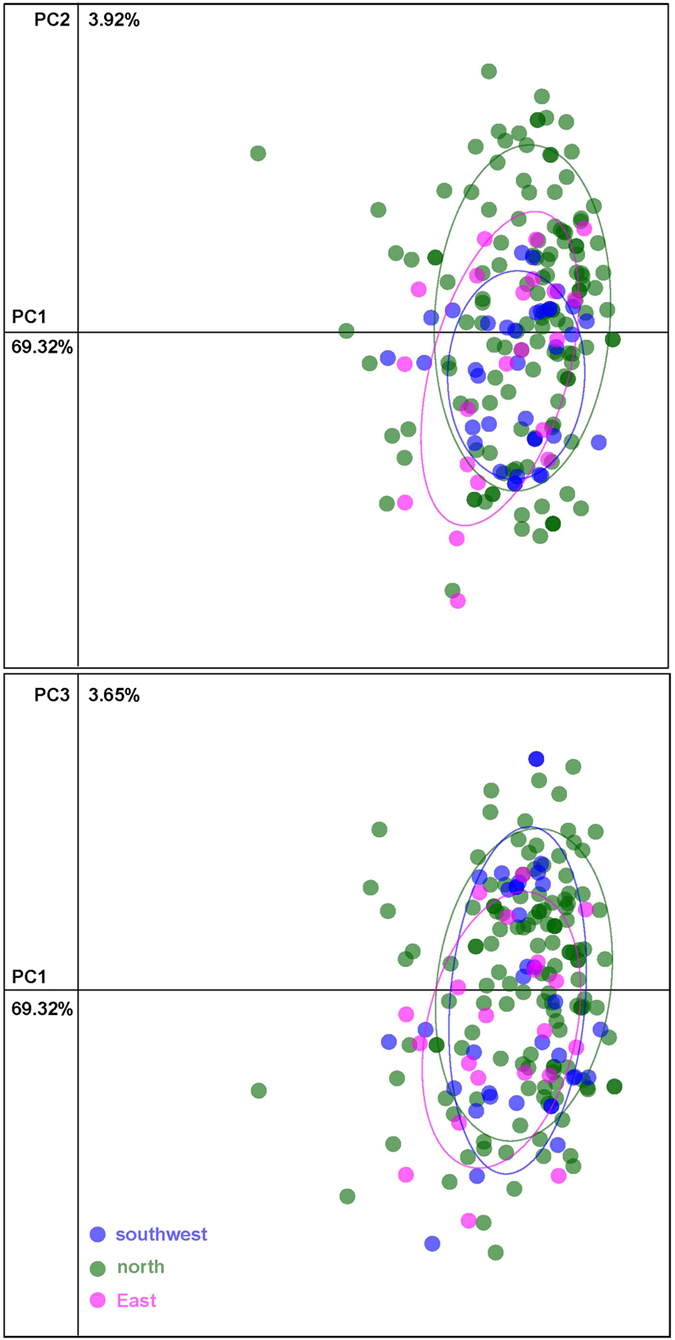
Figure 3. Principal Component Analysis (PCA) of P. orientalis individuals using genetic distance matrices.

Individuals from 3 populations are indicated by the symbols illustrated. P. orientalis. Each point represents one genotypes; the ellipse-line with the same color stands for the boundary of the individuals from the same population source.
