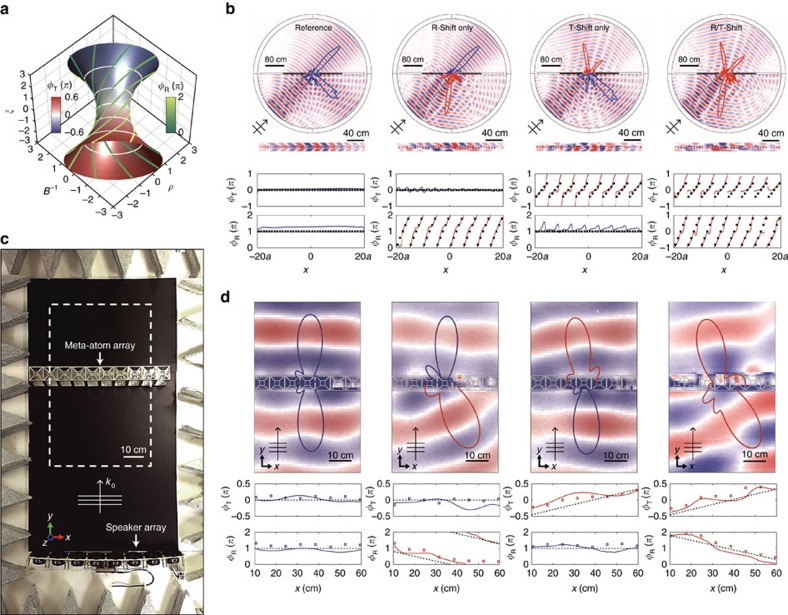
Figure 4. Transmission and reflection decoupled wave front shaping using a bianisotropic meta-surface.
(a) Phase shift contour (ϕR, ϕT) in the parameter octant space of (ρ, B−1, ξ) for a 50:50 power division for the transmitted and reflected waves (Supplementary Note 9). (b) FEM calculated pressure field patterns for an incidence wave from the bottom at 45°. Left to right: reference, shift in the reflection, transmission, and reflection and transmission wavefront. The overlaid far-field polar plots are calculated from the near-field data. Transmission and reflection phases of the meta-atom array (dotted lines are for the design; the solid lines are measured from the FEM calculations) are shown at the bottom of each figure. (c) Top view of the experimental set-up. The experiment was performed with a 10 × 1 meta-atom array in a 70 × 150 × 7 cm box with an acoustic absorber and an 8 × 1 speaker array. (d) Experimentally measured scattered pressure field patterns and calculated far-field polar plots for a normal incidence wave from the bottom. Below the field patterns, the transmission- and reflection-phases of the meta-atom array are shown. Dotted lines for design, square marks from the one-dimensional impedance tube measurements, and solid lines from the experimentally measured pressure field near the meta-surface. Operation frequency is 1,300 Hz, for all cases.

