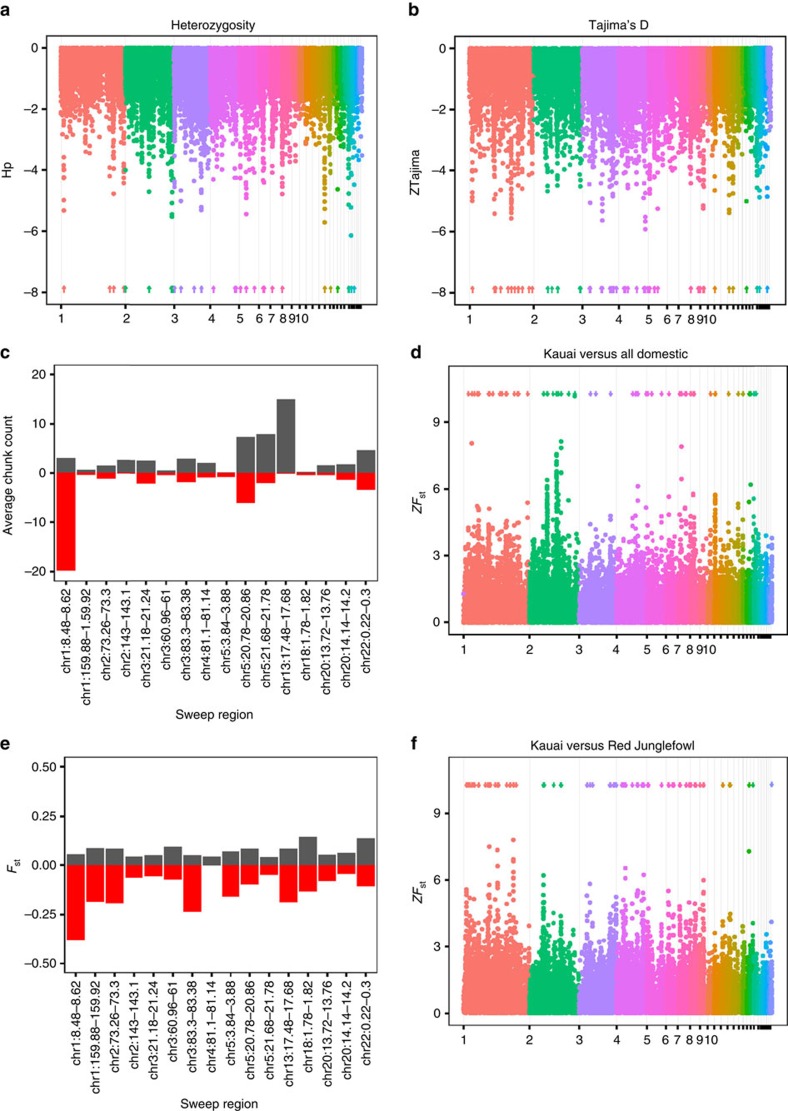
Figure 1. Sweep mapping in the Kauai feral chicken.
Manhattan plots of (a) standardized pooled heterozygosity and (b) Tajima's D in the Kauai population. Chromosomes have alternating colours. For clarity, the labels on microchromosomes have been suppressed. (c) Average number of inferred haplotype segments shared with each pooled domestic chicken (black; averaged across domestics) and pooled Red Jungefowl (red) in each sweep region inferred by Chromopainter. (e) Average FST in sweep regions, comparing Kauai with the all domestic and Red Junglefowl pool. Black bars represent Kauai versus All domestic, and Red negative bars Kauai versus Red Junglefowl. Thus the greater the bar, the greater the differentiation between the Kauai population and the Red Junglefowl population (red, negative bars) or the domestic population (black, positive bars). Manhattan plots of standardized FST in d Kauai versus All domestic and (f) Kauai versus Red Junglefowl.

