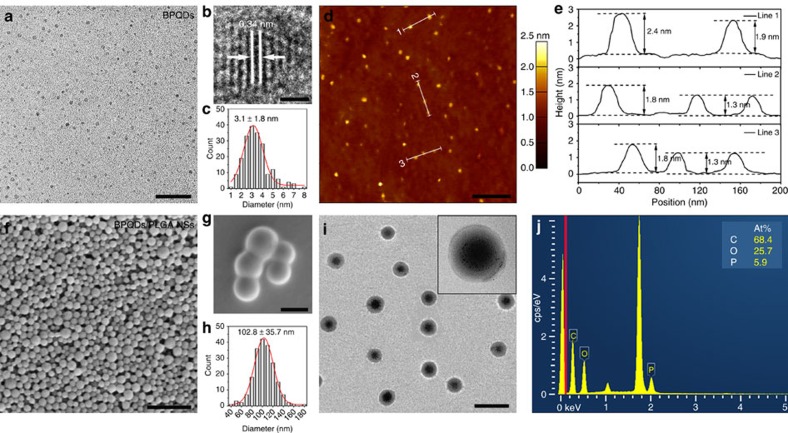
Figure 1. Morphology and characterization.
(a) TEM (scale bar, 20 nm) and (b) high-resolution TEM images of the BPQDs (scale bar, 1 nm). (c) Statistical analysis of the size of 200 BPQDs based on the TEM images. (d) AFM image of the BPQDs (scale bar, 200 nm). (e) Height profiles along the white lines in d. (f,g) SEM images of the BPQDs/PLGA NSs (scale bar, f: 1 μm; g: 100 nm). (h) Statistical analysis of the size of 200 BPQDs/PLGA NSs according to the SEM images. (i) TEM image of the BPQDs/PLGA NSs (scale bar, 200 nm) with the inset displaying the magnified TEM image of a BPQDs/PLGA NS. (j) Energy dispersive X-ray spectroscopy analysis of the BPQDs/PLGA NSs.

