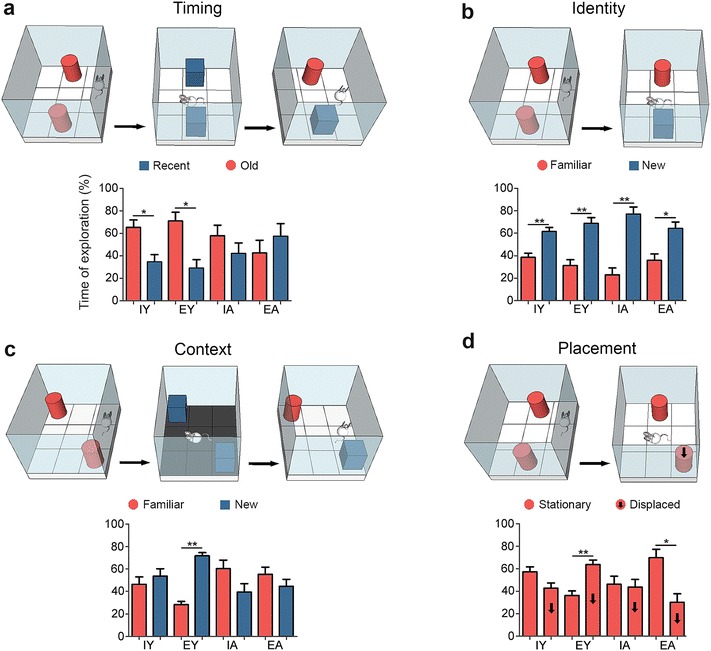
Fig. 2.

Object recognition and contextual memories. a Timing; b Identity; c Context; d Placement. Bars indicate average values of the exploration time ± s.e. for each group. Red and blue filled bars represent differences between objects (displaced vs. stationary, old vs. recent, familiar vs. new). Two-tailed t test for dependent samples; *p < 0.05; **p < 0.001. A SE aged mice from standard environment; A EE aged mice from enriched environment; Y SE young mice from standard environment; Y EE young mice from enriched environment
