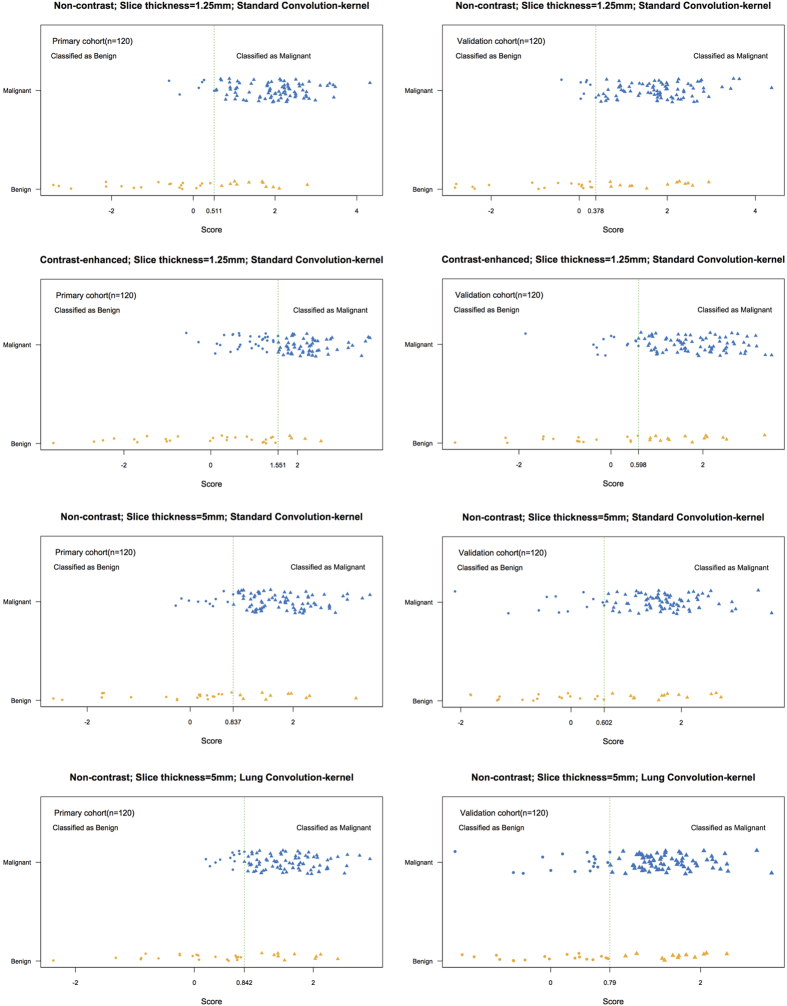
Figure 3. Distributions of score for the radiomics signature on classification SPN status in the primary and validation cohort in different sets of CT imaging (group 1 to group 4).
Y axis indicated the true categories of SPNs and X axis indicted the scores of radiomics signatures, which can be used for predicting the categories of SPNs in each group with the best cutoff. The green dotted vertical lines were drawn for the best cutoff on each group.

