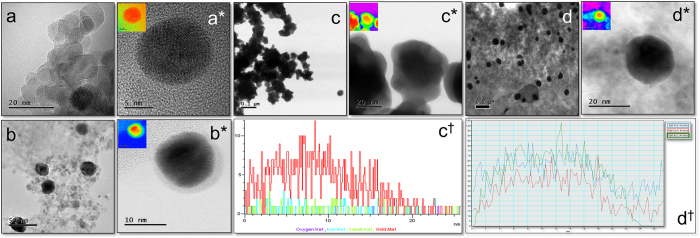
Figure 3.
(a(a*)) TEM, HRTEM image of Nk, TEM and HAADF-STEM image of: (b(b*)) 1st iteration consisting of very thin Au shell and depicting 2 different contrast which proves the formation of core-shell nanoparticles along CTAB layer, (c(c*)) 3rd iteration showing nanoflower formation, (d(d*)) 5th iterative Nk@A with thick Au shell around 6–7 nm (Inset representing the colour mapping of corresponding images), (c†,d†) Line scan analysis showing the distribution of Fe, Co and Au elements from a single nanoparticle.

