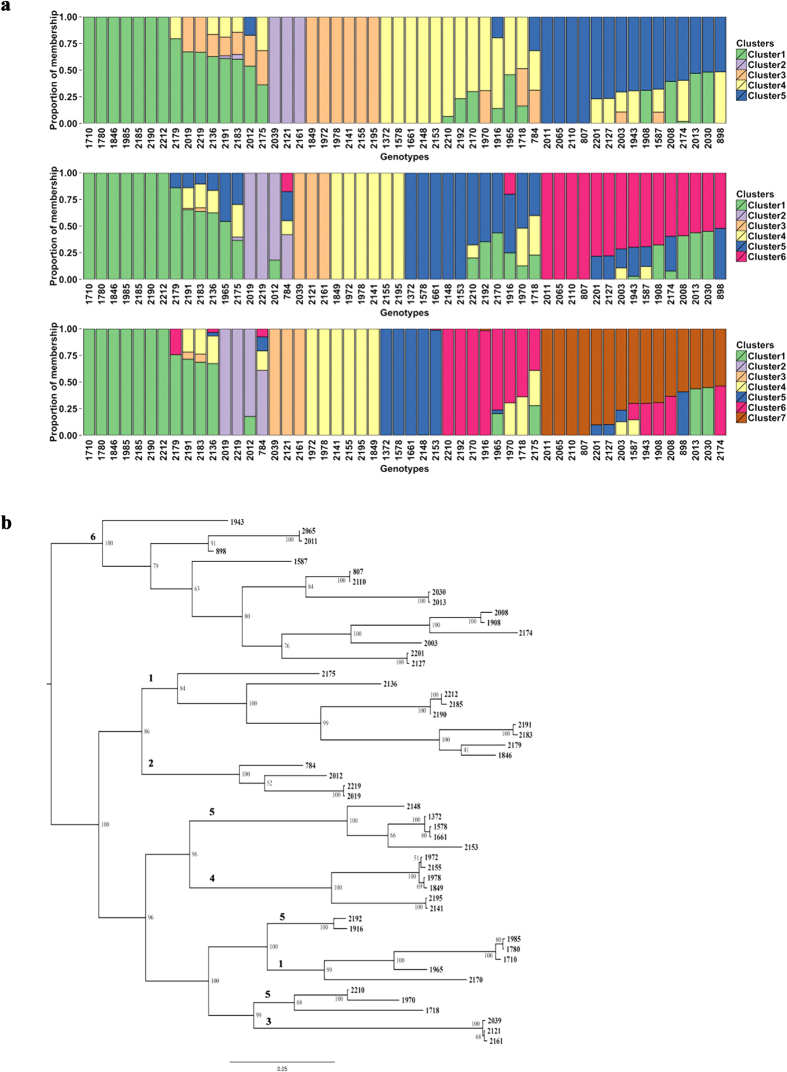
Figure 3. Population structure.
(a) Population structure using variational Bayesian framework–implemented in the program fastSTRUCTURE. The possible 5, 6 or 7 clusters (K = 5, 6 or 7) identified are shown. The Y-axis represents the proportion of membership of a genotype to the respective cluster, and the X-axis indicates genotypes in the collection. (b) Phylogeny built using maximum likelihood implemented in the package SNPhylo. Numbers 1 to 6 represent the clusters identified in Fig. 3a.

