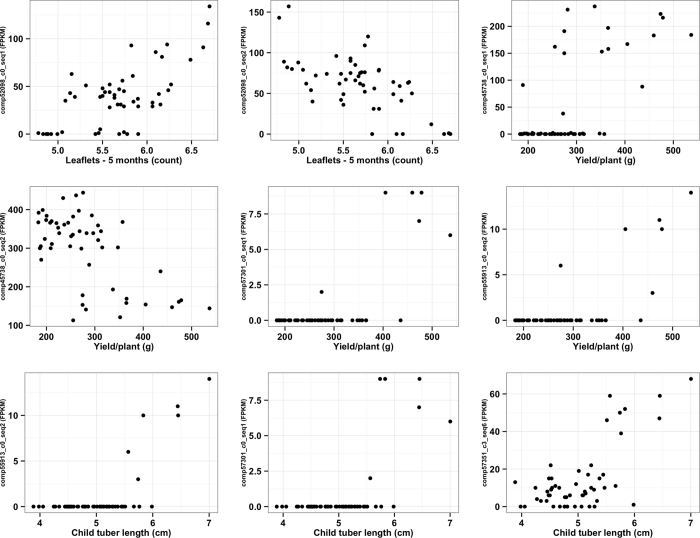
Figure 6. Scatter plots of nine interesting marker-trait associations identified using gene expression markers (GEMs).
Linear regression analysis was performed with 39,609 GEMs as dependent variables, and each of the 20 phenotypic traits as independent variables. We identified 28 GEM-trait associations, nine of which are shown in this figure. The Y-axis of each plot represents FPKM normalized expression values of a transcript for 52 genotypes, and X-axis represents REML-based LS means for the phenotypic trait measured on these genotypes.

