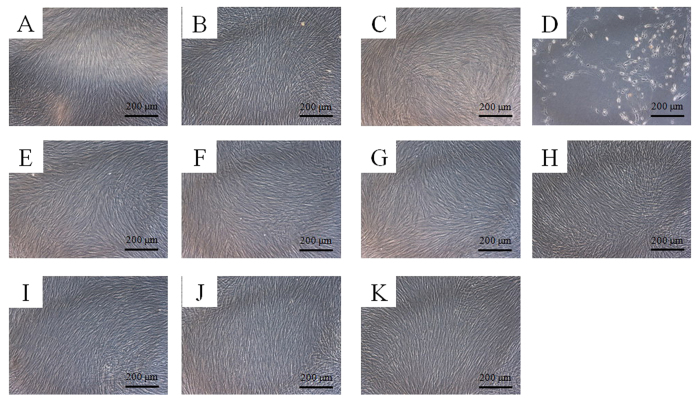
Figure 3. Morphology of the stem cells on day 5.
(A) Unloaded control group. (B) Tacrolimus, 1 μg/mL (TO1). (C) Tacrolimus, 10 μg/mL (TO10). (D) Tacrolimus, 100 μg/mL (TO100). (E) Tacrolimus (0.1 μg/mL) changed with fresh media containing tacrolimus every third day (T3/0.1). (F) Tacrolimus (1 μg/mL) changed with fresh media containing tacrolimus every third day (T3/1). (G) Tacrolimus (10 μg/mL) changed with fresh media containing tacrolimus every third day (T3/10). (H) Unloaded microspheres (MS). (I) Microspheres loaded with tacrolimus at 0.1 μg/mL (TM0.1). (J) Microspheres loaded with tacrolimus at 1 μg/mL (TM1). (K) Microspheres loaded with tacrolimus at 10 μg/mL (TM10).

