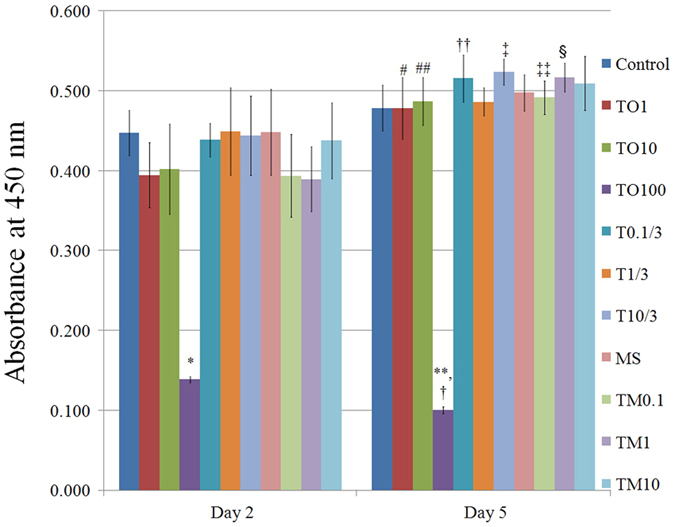
Figure 4. Cellular viability using CCK-8 assay at days 2 and 5.

*Statistically significant differences noted versus control on day 2. **Statistically significant differences noted when compared with the control on day 5. #Significant differences were noted versus TO1 group on day 2. ##Significant differences were noted versus TO10 group on day 2. †Significant differences were noted versus TO100 group on day 2. ††Significant differences were noted versus T 0.1/3 group on day 2. ‡Significant differences were noted versus T 10/3 group on day 2. ‡‡Significant differences were noted versus TM 0.1 group on day 2. §Significant differences were noted versus TM 1 group on day 2.
