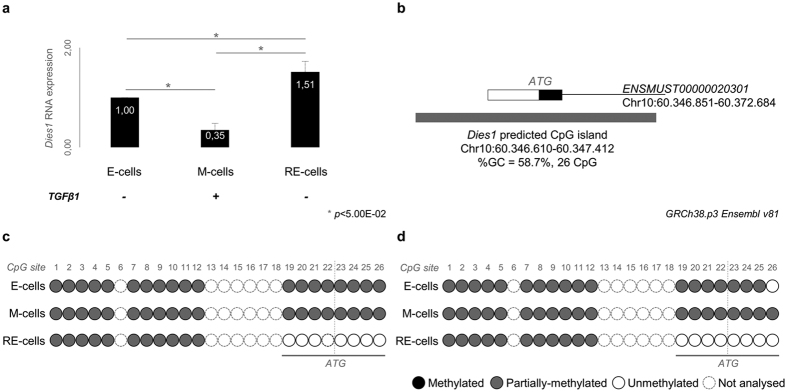
Figure 1. Dies1 expression and regulation across an in vitro model of EMT and MET.
(a) Dies1 expression in E-, M- and RE-cells. Asterisks stand for significantly distinct comparisons (p < 5.00E-02). (b) Schematic representation of Dies1 predicted CpG island in mouse. White rectangle for Dies1 5′UTR in exon 1. Black rectangle for coding region of exon 1. Grey rectangle for the predicted CpG island. (c,d) Two examples of the results obtained for the direct-sequencing of Dies1 predicted CpG island. Representation of each CpG site using white circles for unmethylated CpG sites, grey circles for partially-methylated CpG sites and black circles for fully methylated CpG sites.

