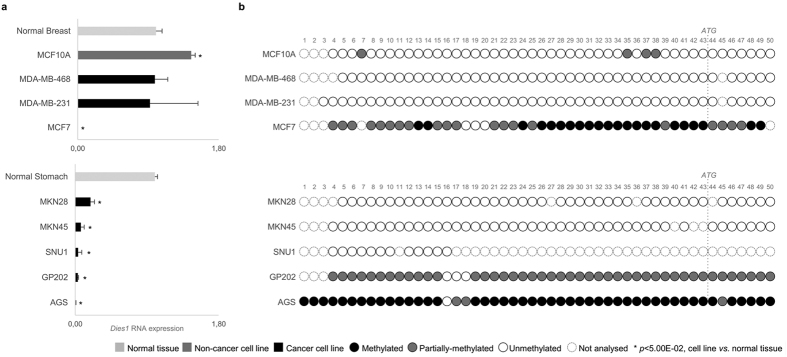
Figure 3. Dies1 expression and promoter methylation status in a panel of breast cancer, gastric cancer and colorectal cancer cell lines.
(a) Dies1 expression in a panel of breast cancer cell lines (MDA-MB-468, MDA-MB-231 and MCF7) normalized to normal breast tissue and of gastric cancer cell lines (MKN28, MKN45, SNU1, GP202 and AGS) normalized to normal gastric tissue. Also included is the near-normal breast cell line MCF10A (non-cancer, dark grey bar). Light grey bars to normal tissues and black bars correspond to cancer cell lines. Asterisks stand for significantly distinct comparisons (p < 5.00E-02). (b) Dies1 promoter methylation status in all described cancer cell lines (and MCF10A). Representation of each CpG site using white circles for unmethylated CpG sites, grey circles for partially-methylated CpG sites, black circles for fully methylated CpG sites and dashed white circles for unassessed CpG sites.

