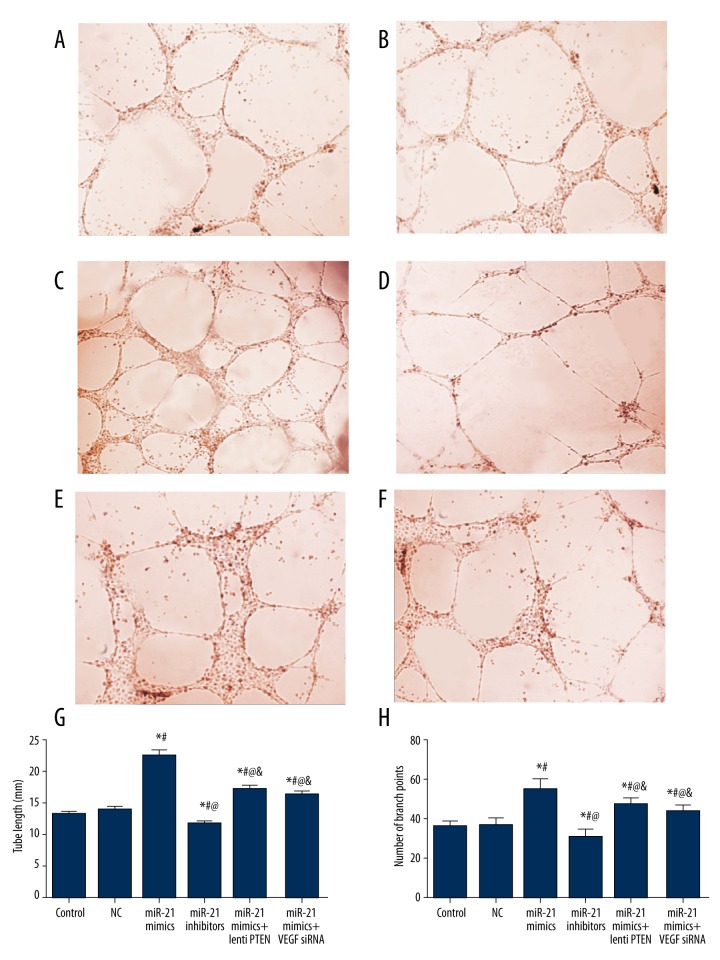
Figure 10.
Results of tube formation assay in CMEC cells. (A–F) Tube formation assay in vitro in the control (A), NC (B), miR-21 mimics (C), miR-21 inhibitors (D), miR-21 mimics + lenti PTEN (E), and miR-21 mimics + VEGF siRNA (F) group. (G, H) Quantitative data of tube length (G) and tube branch point (H) in CMECs. Data are presented as mean ±SD for 3 independent experiments. * P<0.05 versus control group, # P<0.05 versus NC group, @ P<0.05 versus miR-21 mimics group, & P<0.05 versus miR-21 inhibitors group.

