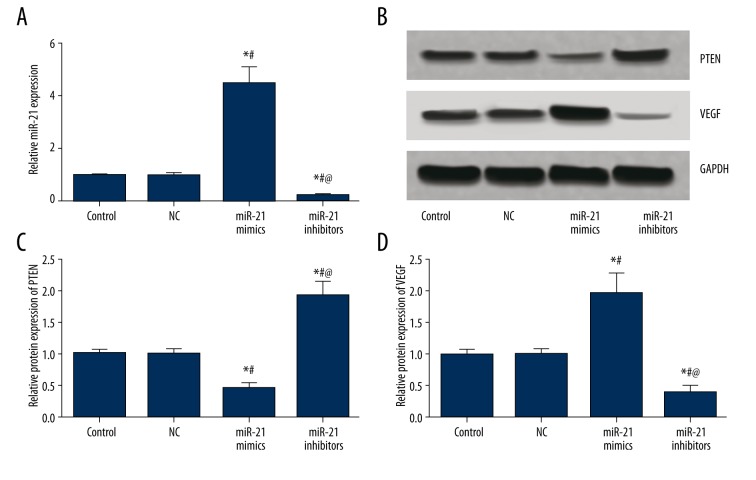
Figure 3.
MiR-21, PTEN, and VEGF expressions in BMSCs after transfection. (A) Semi-quantitative levels of miR-21in BMSCs among different groups (control, NC, miR-21 mimics, and miR-21 inhibitors). (B) Western blot analysis of PTEN and VEGF in BMSCs with GAPDH as internal control. (C, D) Quantitative protein level of PTEN (C) and VEGF (D) in BMSCs. Data are presented as mean ±SD for 3 independent experiments. * P<0.05 versus control group, # P<0.05 versus NC group, @ P<0.05 versus miR-21 mimics group.

