
Figure 2. Stability of the Original Effect across Time and the Perceptual Heterogeneity for Six Visual Tasks.
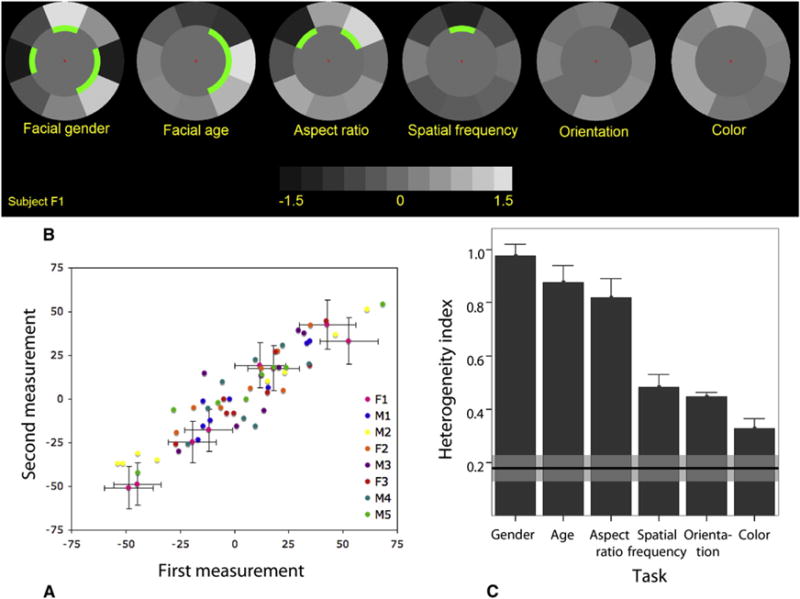
(A) Scatter plot comparing the first and second measurements of PSEs for eight subjects at each of the eight locations.
(B) PSE mosaics for the five visual tasks for one of the subjects. To make it possible to compare the heterogeneity magnitude across five different tasks, we normalized PSEs of each task to the corresponding just noticeable difference (JND). The color map indicates PSE/JND.
(C) Heterogeneity indices. The bar plot demonstrates the perceptual heterogeneity index (see Results) for the five investigated visual tasks. The horizontal black line and gray band indicate the mean ± 1 standard error (SE) of the heterogeneity index expected with local biases due only to noise (based on Monte Carlo simulation). Error bars show ±1 SE of mean.