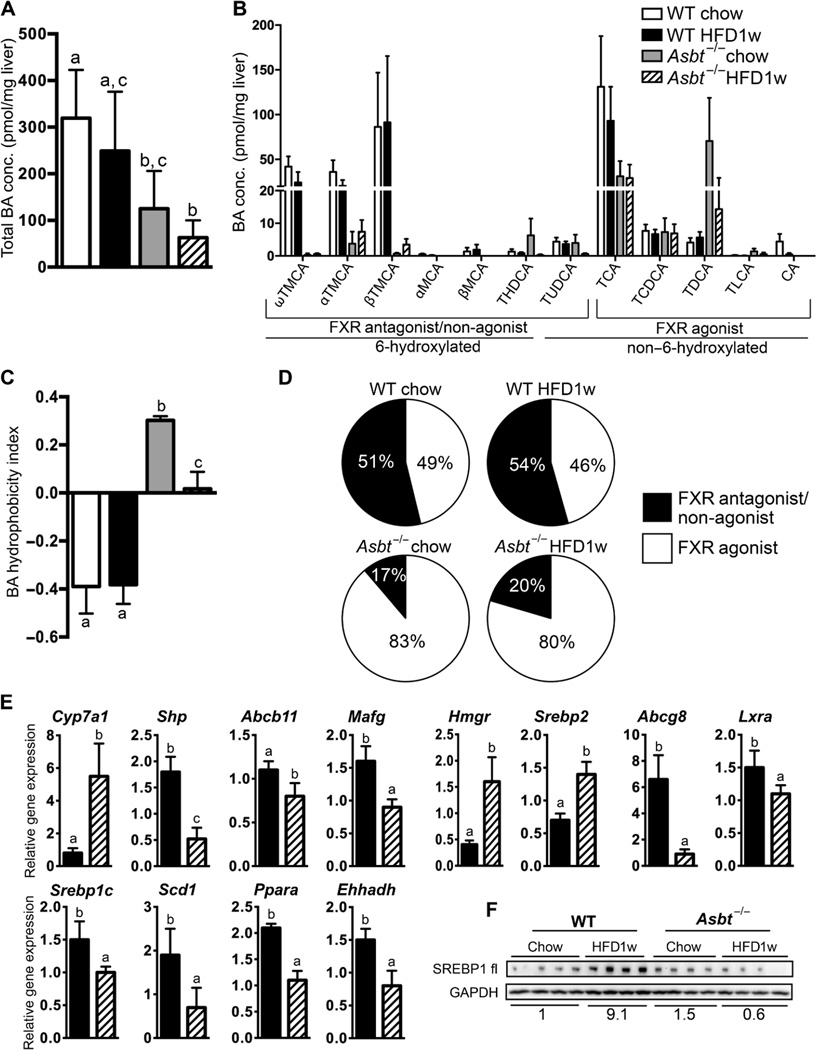
Fig. 8. Hepatic BA composition is altered in Asbt−/− mice.
(A) Total hepatic BA content and (B) BA composition. (C) Hydrophobicity index and (D) Pie charts for hepatic FXR antagonist/non-agonist (black) and agonist (white) BA content. (E) Hepatic gene expression in WT and Asbt−/− mice fed a HFD for 1 week. Values shown are relative to chow-fed WT mice. (F) Protein expression of full-length (fl) SREBP1 increased in HFD-fed WT mice but not in HFD-fed Asbt−/− mice. SREBP1 expression was normalized to the amount of the housekeeping protein GAPDH and the quantitation is shown below the blot. The labeling scheme for each group is indicated in the embedded legend. Mean ± SD are shown. Distinct lowercase letters indicate significant differences between groups; individual P values are provided in table S1.

