
Figure 3.
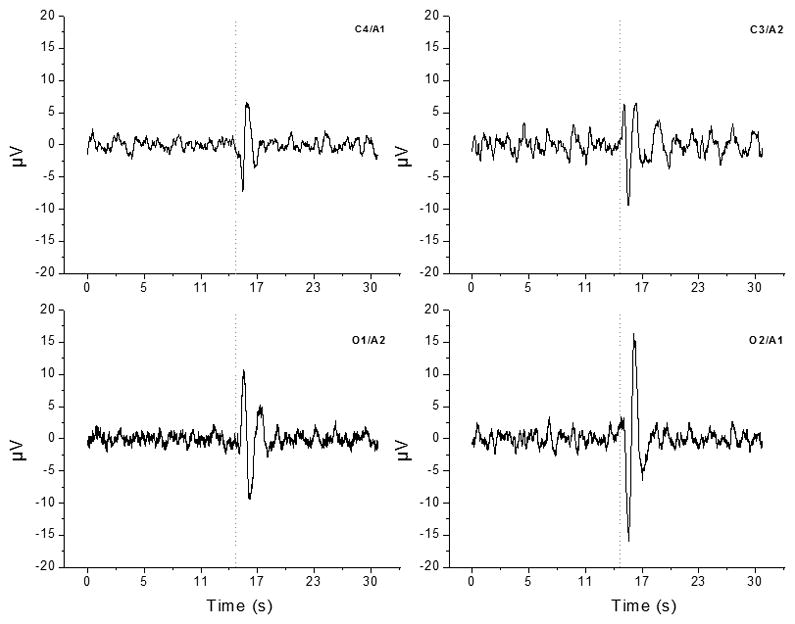
The ERP generated from subjects exposed to the flash sequence during sleep. Each ERP represents the average 30-second EEG waveform during the one-hour exposure. Data were averaged within then between subjects for each of the four derivations (two central – C4 and C3, two occipital – O1 and O2). Data are centered on the timing of the flash (dotted line). Robust changes are observable in both the occipital (primary visual) cortex channels with lesser but still obvious changes in both the central cortical channels, confirming that the flash signal is passing through the eyelids and impacting brain firing patterns.