
Figure 4.
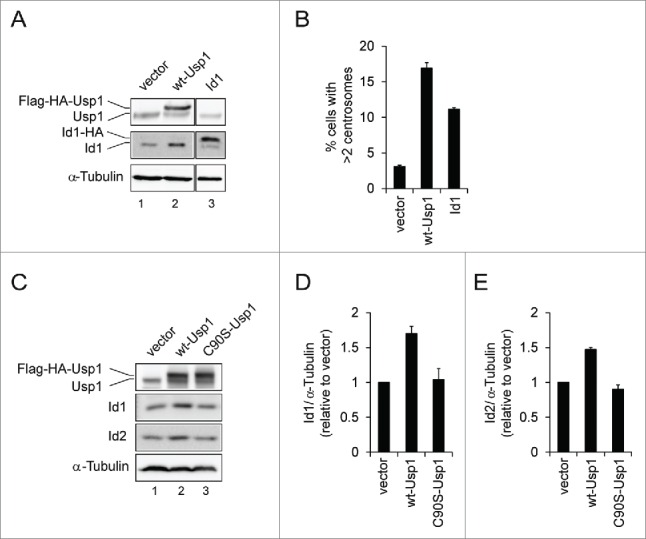
Overexpression of wt-Usp1, but not C90S-Usp1, stabilizes the levels of ID1 and ID2 (A-B) NIH3T3 cells were infected with retrovirus carrying murine Id1 and selected with puromycin to generate pools of resistant cells. (A) Cell lysates were immunoblotted with indicated antibodies. (B) Histograms showing percentage of cells with extra centrosomes (>2). Cumulative data from 3 independent experiments with at least 150 cells counted per experiments. Values represent the mean ± SEM. (C-E) Quantification of the ratio of ID1 to α-tubulin and ID2 to α-tubulin in vector-, wt-Usp1, and C90S-Usp1 NIH3T3 cells. Representative example of immunoblots analysis of NIH3T3 cells (C). The ratio of ID1/α-tubulin (D) and ID2/α-tubulin (E) was determined by densitometry analysis of the immunoblot bands. The values represent the mean ± SEM of 3 independent experiments.