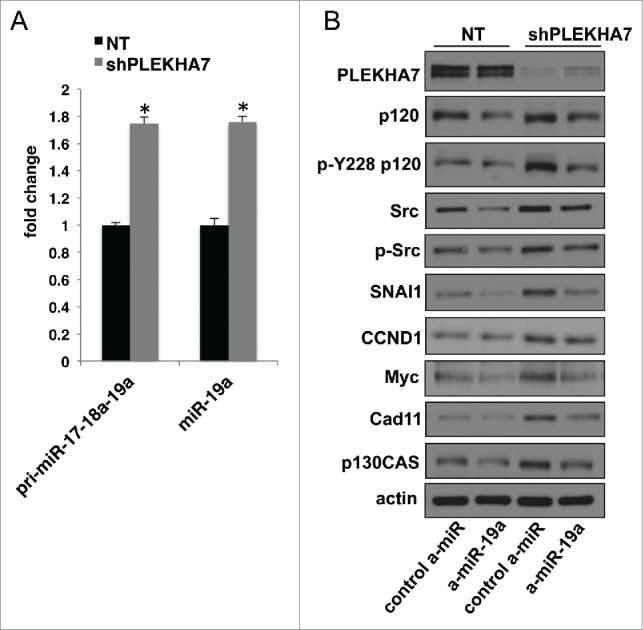
Figure 4.

PLEKHA7 loss results in upregulation of growth-related markers via miR-19a (A) qRT-PCR analysis of Caco2 control (NT) or PLEKHA7 knockdown (shPLEKHA7) cells for pri-miR-17-18a-19a and mature miR-19a (mean ± s.d. from n = 3 independent experiments; *P < 0.0001, Student's two-tailed t-test). (B) Western blot of NT and shPLEKHA7 Caco2 cells transfected with the either control or anti-miR-19a constructs and blotted for the markers shown; Actin is the loading control.
