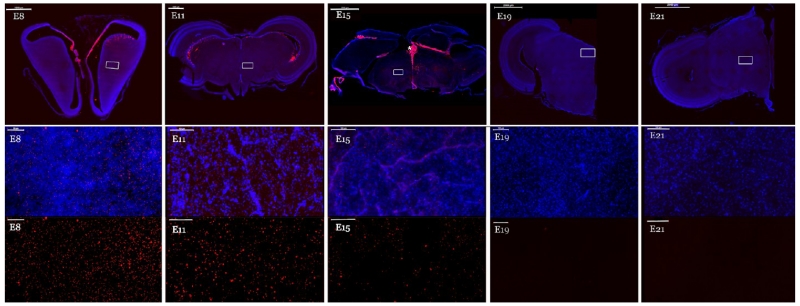
Figure 5.
QD-CL4 peptide conjugate distribution at different developmental time points. QD-CL4-JB577 distribution is shown in representative coronal sections of the embryonic chick brain at developmental ages, E8, E11, E15, E19, and E21 from embryos injected at E4. The upper panel shows composites of QD-CL4-JB577 distribution (red fluorescence) in E8 forebrain and E11, E15, E19, and E21 midbrain sections counterstained with DAPI (blue). The middle panel depicts a magnified randomly selected region of each section marked with a white box in each upper panel. The asterisk (*) shows the choroid plexus at E15. The lower panels correspond to each middle panel but only show QD fluorescence. The magnification bar in the upper panel represents 2000 μm and in the middle and bottom panels represents 100 μm.

