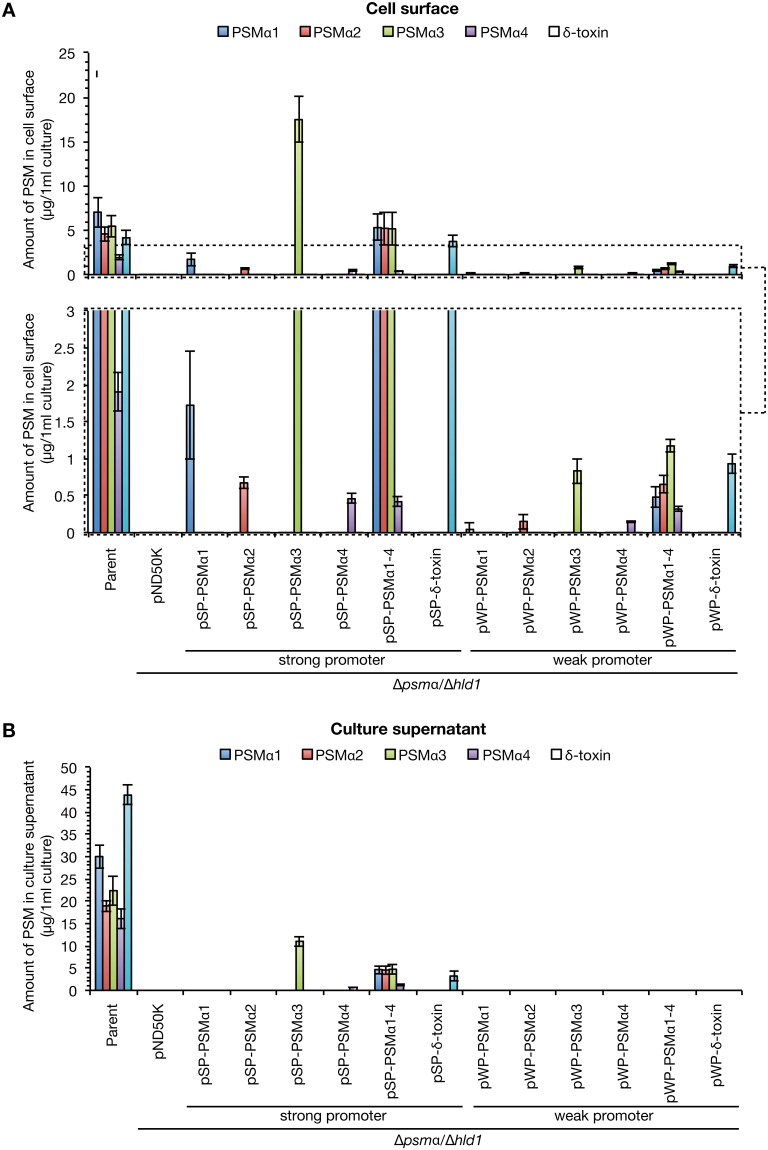
Fig 7. Construction of S. aureus strains expressing different PSMs in different locations.
S. aureus PSMα1-4/δ-toxin knockout strain (Δpsmα/Δhld1) was transformed with genes encoding PSMα1, PSMα2, PSMα3, PSMα4, PSMα1–4, and δ-toxin, which were placed under a strong or weak promoter. S. aureus Newman strain (Parent), the PSMα1-4/δ-toxin knockout strain transformed with empty vector (pND50K), and the strains transformed with different PSM genes were cultured for 19 h. The amount of each PSM on the cell surface (A) or in the culture supernatant (B) was measured by HPLC. In (A), a part of the graph is enlarged in a lower graph (dotted boxed region). Vertical axis represents the amount of each PSM per 1 ml bacterial culture. Data are means±standard errors from three independent experiments.

