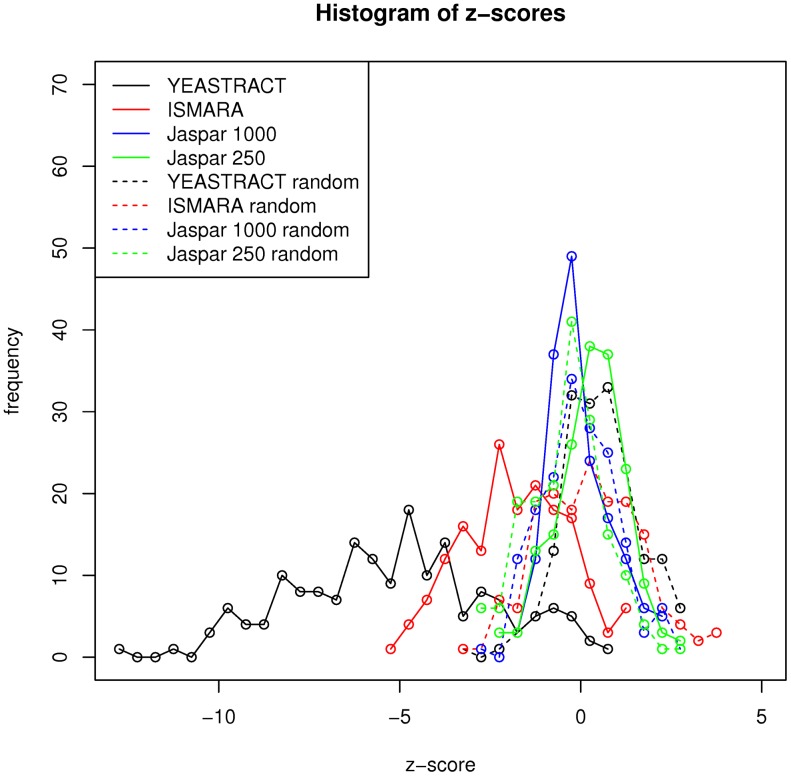
Fig 4. Z-score distributions of the comparison of the i-scores of the Act-A* solution for the real and randomized Gasch data.
A negative z-score indicates that the i-score was smaller/better for the real data than for the randomized data. These z-scores were calculated for the YEASTRACT, ISMARA and Jaspar network and a random network with the same number of edges for each of these networks. When the YEASTRACT network is used the i-score is much better for the real than for the random data, whereas the scores are about the same for the Jaspar network.

