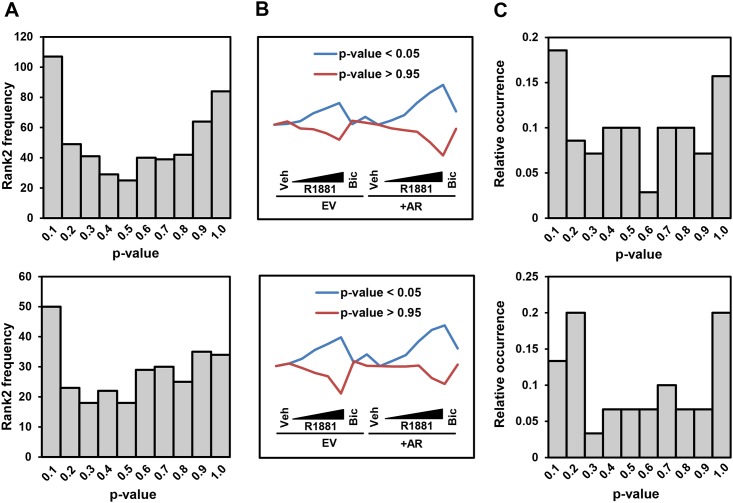
Fig 7. Rank 2 and functional validation of predicted androgen receptor (AR) TGs.
The candidate differentially-expressed genes were sourced from two comparator groups: Vehicle treatment versus largest R1881 dose, for both AR-overexpressed (top panels) and empty-vector (bottom panels) cells. A) Binomial distributions of the spread of Rank 2 DE genes at different KSC p-values indicating that Rank 2 genes are more likely to appear at lower and higher ends of p-value spectrum. B) The average expression profiles of TGs at lower and higher ends of the p-value range (p-value < 0.05 or > 0.95). These two groups show a highly negative correlation—i.e., corr = -0.94 and -0.75 for top and bottom diagrams, respectively. C) Functional analysis of predicted TGs where density of occurrence of DE genes significantly representing AR function (as given in Table C of S3 File) is plotted at different KSC p-values; nearly similar binomial patterns as of Rank 2 analysis.

