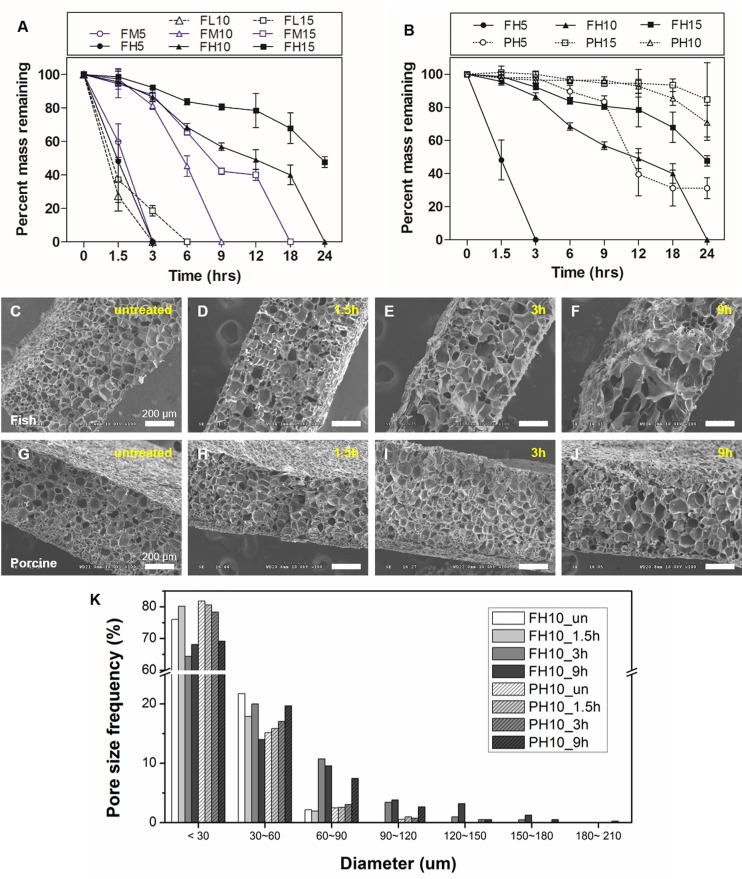
Fig 5. Degradation characteristics of fish GelMA hydrogels.
(A) Degradation profiles of fish GelMA hydrogels with various degrees of methacrylation (low, medium and high) and GelMA concentrations (5%, 10% and 15%) upon exposure to collagenase type II. (B) Comparison of fish and porcine GelMA hydrogels with high degree of methacrylation and 10% gel concentration. Error bars represent SDs of measurements performed on three samples. Representative cross-sectional SEM images of fish GelMA (C~F) and porcine GelMA (G~J) hydrogels reveal different gel morphologies after degradation with collagenase type II. (K) Pore size distribution of GelMA hydrogels (Pore size frequency obtained from 5 SEM images per condition).

