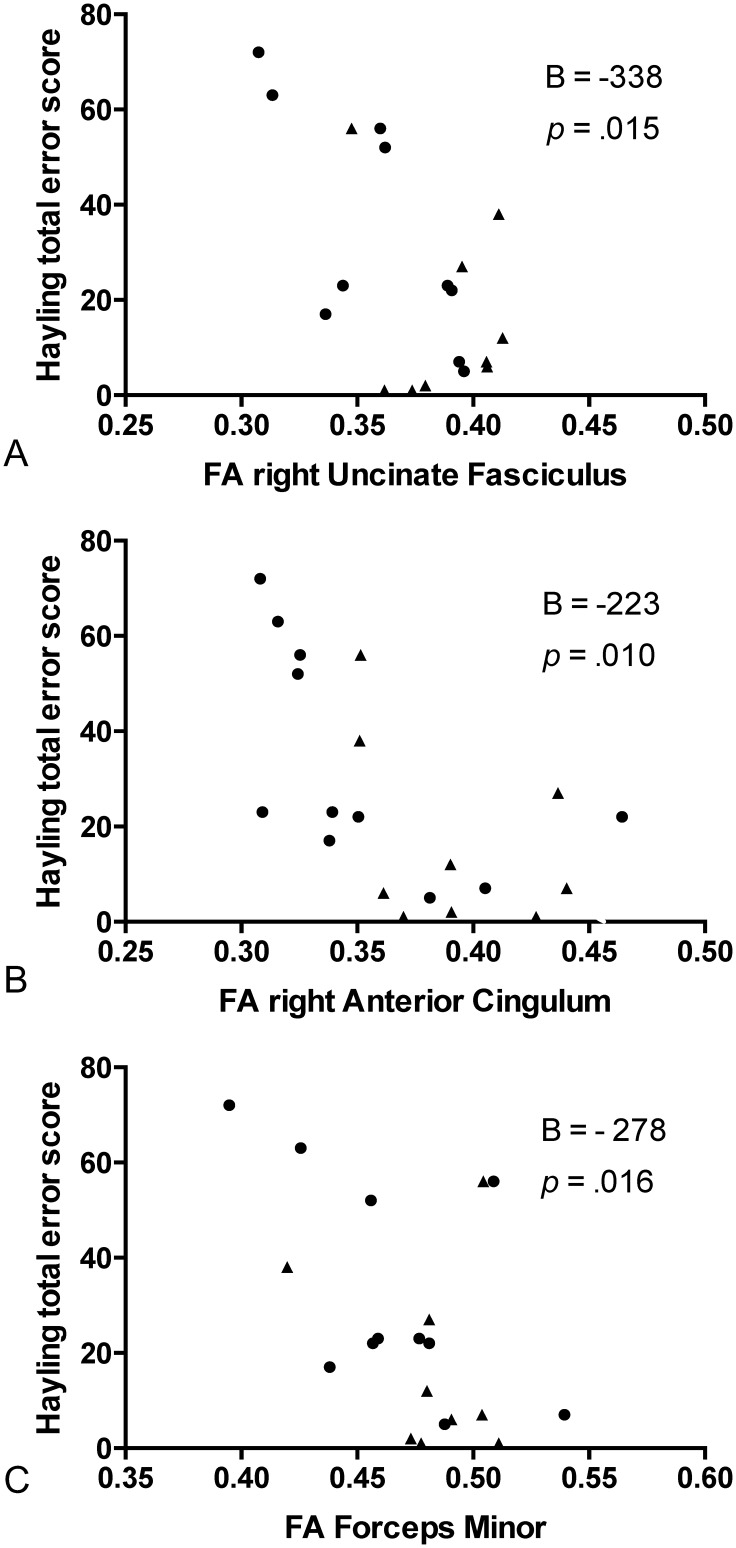
Fig 3. Fractional anisotropy and Hayling error score correlations.
Scatter plots of total error score on the Hayling test and fractional anisotropy (FA) of tracts in patients with behavioural variant frontotemporal dementia (dots) and progressive supranuclear palsy (triangles), for A: the right uncinate fasciculus, B: the right anterior cingulum, and C: the forceps minor. B (adjusted) and p are derived from the linear regression model, with age as covariate.

